student success
National College Student Satisfaction Results for 2023
Each year, RNL updates the national comparison group data that are provided to institutions administering the Student Satisfaction Inventory (SSI), the Adult Student Priorities Survey (ASPS) or the Priorities Survey for Online Learners (PSOL) with their student populations. These national comparisons provide perspectives on how institutionally specific satisfaction scores may be higher or lower than students nationally. The data reflect the most recent three academic years, which currently are the fall of 2020 through the spring of 2023. For the first time since 2020, all of the data now reflect the student experience since the pandemic became a part of our world, rather than bridging before and after as they did last year.
The big picture on student satisfaction
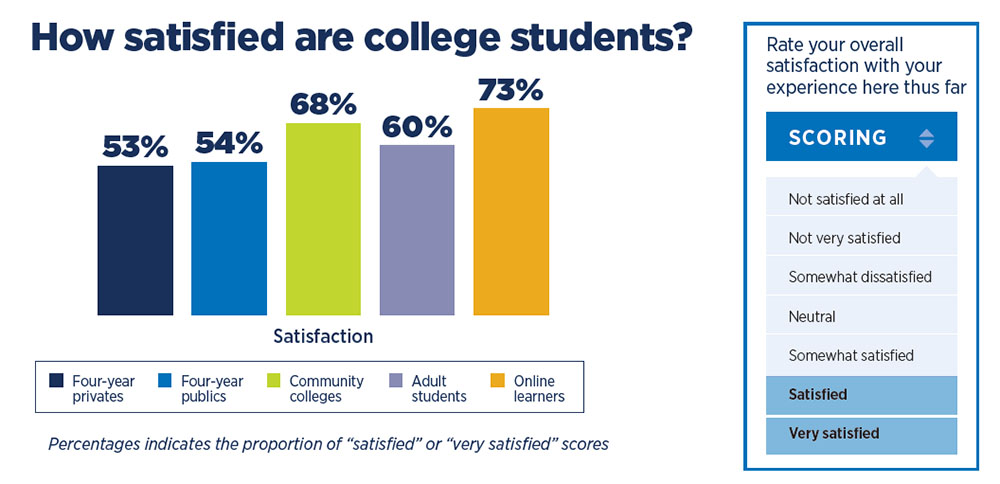
When asked to indicate their overall satisfaction with their experience, the scores below display the students who indicate that they were satisfied or very satisfied.
Download the 2023 National Student Satisfaction and Priorities Results
The pattern of responses here have remained consistent year over year, with online learners and students at community colleges having the highest satisfaction levels overall. Adult students reflect a mix of undergraduate adult learners and graduate level students.
Observations on student satisfaction trends
When comparing overall satisfaction scores isolated for just students completing the surveys in each academic year, 2018-2019 through 2022-2023, the following trends have been observed by institution type:
Four-year privates
- Satisfaction in 2022-2023 is steady compared with the 2021-2022 academic year.
- Satisfaction in 2022-2023 is lower overall compared with the academic years prior to the pandemic.
Four-year publics
- Satisfaction in 2022-2023 is higher compared with the 2021-2022 academic year.
- Satisfaction in 2022-2023 is lower overall compared with the academic years prior to the pandemic.
Community colleges
- Satisfaction in 2022-2023 is slightly higher compared with the 2021-2022 academic year.
- Satisfaction in 2022-2023 is higher overall compared with the academic years prior to the pandemic.
Adult undergraduate and graduate students
- Satisfaction in 2022-2023 is lower compared with the 2021-2022 academic year.
- Satisfaction in 2022-2023 is lower overall compared with the academic years prior to the pandemic.
Online learners
- Satisfaction in 2022-2023 is slightly higher compared with the 2021-2022 academic year.
- Satisfaction in 2022-2023 is steady overall compared with the academic years prior to the pandemic.
Based on these results, community colleges and online learning programs appear to have best weathered the fall out from the pandemic on higher education.
Highlights from this year’s report
This year’s report is a streamlined version that looks at a few critical elements of the student experience which can make a difference with student success and graduation rates:
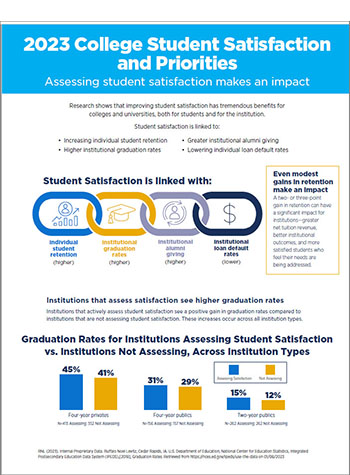
- National research on the link between student satisfaction and critical institution metrics.
- Overall satisfaction levels across institution types.
- The critical link between the perception of institutional choice and overall student satisfaction.
- An overview of the top factors that influence students’ decisions to enroll at their institution, across institution types.
In addition, you have the option to download the top strengths (high importance / high satisfaction) and top challenge items (high satisfaction / low satisfaction) for each of the five institution types/student populations to gain an understanding of what is rising to the top nationally when it comes to priorities to celebrate on campus and where more work needs to be done at campuses across the country. More than 660 institutions are included in the national results with responses from more than 362,000 students at four-year privates, publics, community colleges and institutions serving adult undergrad and graduate students as well as online learners. You can also watch our webinar on the results, National Student Satisfaction Results: Data That Inform Retention and Recruitment.
How satisfied are your students?
Understanding national trends and comparing across institution types is valuable, but the real value of student satisfaction is when it reflects the experience of students on your campus. Institutions that prioritize not only gathering these data regularly but who also invest the time and energy to intentionally share and use the data to inform decision making are seeing satisfaction levels improve and retention rates increase.(Here are three examples from campuses that illustrate how they use college student satisfaction data for planning.)
Do you know how satisfied your students are with the academic experience you are providing? If not, you may want to add a student satisfaction survey to your assessment calendar. Learn more about how you can implement student satisfaction surveys on campus with the RNL Satisfaction-Priorities Assessments, taken by more than 7,000,000 students at 3,000 institutions.
Complimentary consultation on student satisfaction assessment
Talk to our satisfaction assessment experts about how you can easily implement the survey on your campus, including when is the best time to survey and how to get strong completion rates.
About the Author

Julie L. Bryant, vice president for student success at RNL, works directly with colleges and universities throughout North America in the area of satisfaction assessment. Julie is responsible for client service to more than 2,700 institutions...
Read more about Julie's experience and expertise
Reach Julie by e-mail at Julie.Bryant@RuffaloNL.com.