student success
Highlights From the 2022 National Student Satisfaction and Priorities Report

The 2022 National Student Satisfaction and Priorities Report takes a closer look at this year’s national data in three important ways:
- Five-year trends in overall student satisfaction, reflecting scores from before and after the pandemic;
- Student satisfaction across institution and student type for several critical areas; and
- A closer look at the perceptions of student satisfaction in the area of campus climate.
The report reflects more than 362,000 student records from 639 four-year and two-year institutions that administered one of the RNL Satisfaction-Priorities Surveys between the fall of 2019 and the spring of 2022.
Overall student satisfaction
The chart below reflects the overall satisfaction levels for students at four-year privates, four-year publics, and community colleges, as well as adult graduate/undergraduate students and online learners.
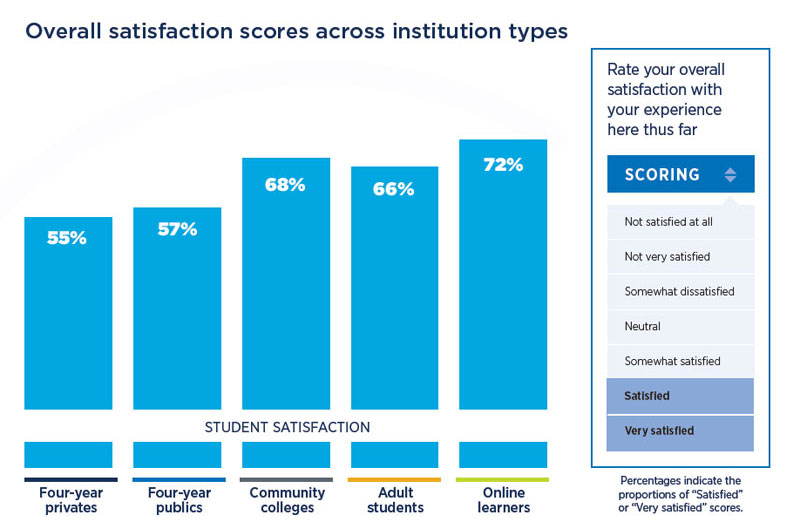
Overall satisfaction levels are important to track because they have been linked to individual student retention, institutional graduation rates, and alumni giving rates. (You can learn more in the studies we have published on these topics). As this chart reflects, the trend continues to show nontraditional populations have higher overall satisfaction with their experience than traditional students studying at four-year private and public institutions.
The full report unpacks these scores further, for each institution/student type to compare overall satisfaction in each of the academic years of 2017-18, 2018-19, 2019-20, 2020-21, and 2021-22 to document how student satisfaction may have been impacted by the pandemic. Of particular note in this five-year perspective:
- There are higher satisfaction levels in 2019-20 potentially because of the higher number of responses from the fall of that year, before the immediate pandemic impact. Students are historically more satisfied in the fall semester than they are in the spring semester.
- Both four-year privates and publics reflect declining satisfaction since the pandemic, while community colleges satisfaction has gone up in the two most recent academic years.
- Satisfaction levels have remained consistent for adults and online learners, perhaps because their experience is mostly unchanged as a result of the pandemic and/or because they have different priorities and expectations than traditional-age students.
Read the 2022 National Student Satisfaction and Priorities Report
What does student satisfaction look like in our post-pandemic world? How has it changed in recent years?
Read our latest student satisfaction report to find out. The 2022 report looks at results from 362,000 student records for students at four-year and two-year institutions as well as adult students and online learners.
Student satisfaction in critical areas
While studying student satisfaction for more than 20 plus years, RNL has found the following survey items to be especially important for institutions to monitor in order to best serve students:
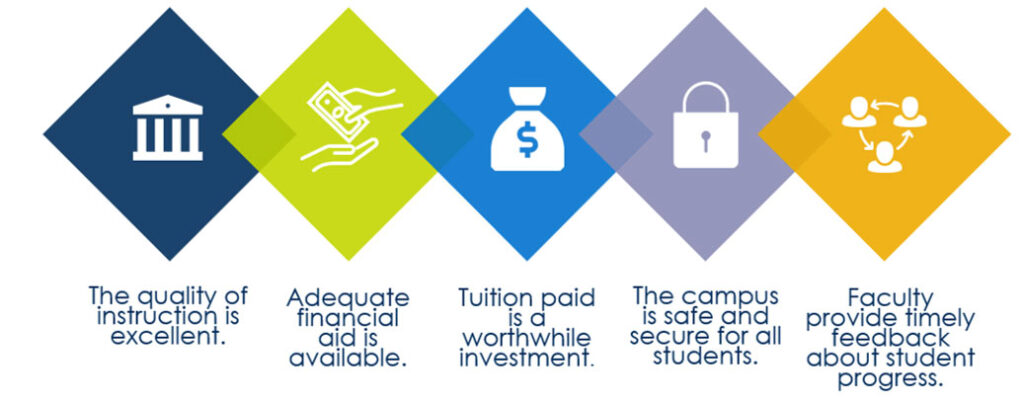
The 2022 National Report compares the level of importance and the percentage of students who are satisfied or very satisfied in these high priority areas across the five data sets. Are you tracking student satisfaction in these areas as well to provide your students with the best overall experience at your institution?
Campus climate—how do students feel at your institution?
Being student-focused has been a priority for campuses focused on student success for years. It is now more in the forefront as institutions compete with many employment opportunities without college degrees required and while the upcoming demographic cliff looms. An institution’s campus climate—which is another way of saying how students feel on the campus—can make a big difference in whether students choose to stay or leave. Attracting and keeping students with a positive campus environment becomes even more important. You also need to consider that how students feel about their institution may play a bigger role when there are a variety of modalities and options for students to get a degree. Students are no longer place-bound in the way they were even ten years ago.
Paying attention to campus climate items is one way for your institution to control what you can control by providing the best service to students, either in-person or virtually. Positive campus climates are also a way to keep students engaged with their educational experience and to potentially stay engaged as future alumni.
This year’s report looks at the importance and satisfaction levels students in each data set have on items that reflect the way that the institution makes them feel welcome, gives them a sense of belonging, provides campus staff that are caring and helpful, and responds to requests for information. The data reflect that community colleges in particular are doing a good job meeting student expectations in these areas.
Next steps
If you haven’t already, I invite you to download the full report to see how your institution type is performing when it comes to serving students in areas that matter to them.
I also presented a 50-minute webinar on the 2022 National Report in November, which you can watch on demand if you and others on your campus are interested in learning more about this topic.
And if you aren’t currently assessing student satisfaction regularly on your campus, I invite you to consider administering one of the survey instruments from RNL. The Student Satisfaction Inventory (SSI) for traditional students at four-year and two-year institution, the Adult Student Priorities Survey (ASPS) for graduate and undergraduate adult students, and the Priorities Survey for Online Learners (PSOL) for online learners can help you to clearly identify where your institution is performing well and what are your priority areas for improvement. College leaders tell us they use the data to guide their student success/retention efforts, to document their accreditation work and to provide the student voice for strategic planning activities.
National data provide a helpful general view of what is happening in higher education, but having data from your own students will best inform what you need to improve on your campus. Please contact me or my colleague Shannon Cook if we can answer any questions on how to get started with a satisfaction assessment on your campus.
Complimentary consultation on student satisfaction assessment
Talk to our satisfaction assessment experts about how you can easily implement the survey on your campus, including when is the best time to survey and how to get strong completion rates.
About the Author
Julie L. Bryant, vice president for student success at RNL, works directly with colleges and universities throughout North America in the area of satisfaction assessment. Julie is responsible for client service to more than 2,700 institutions...
Read more about Julie's experience and expertise
Reach Julie by e-mail at Julie.Bryant@RuffaloNL.com.