enrollment
Using FAFSA data ethically and strategically for enrollment management
There has been a lot of media attention lately in the higher education community about FAFSA position codes. Unfortunately, at least a couple of these articles had sensationalized headlines implying that this very important data was being misused by schools, against students.
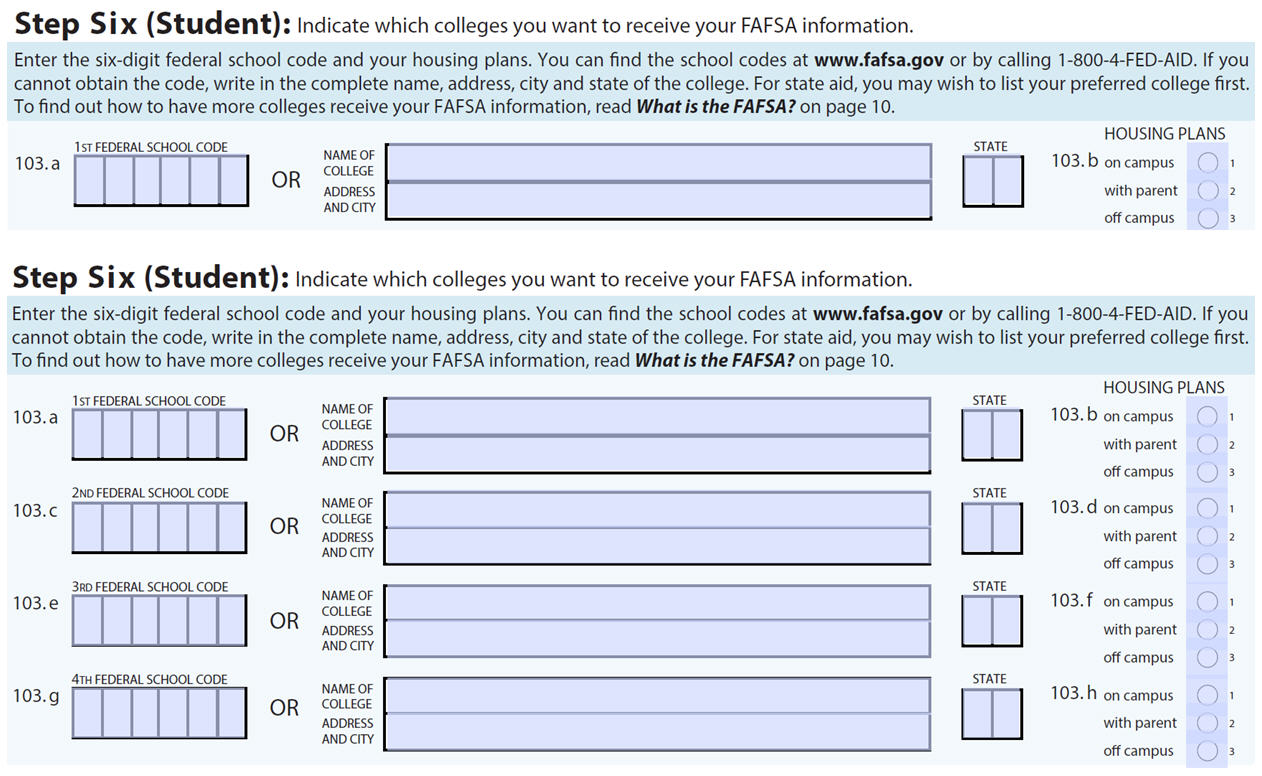
First of all, what are we talking about? On the paper FAFSA application, students are given the option to indicate up to four colleges where they wish to have the FAFSA data sent. On the electronic application, they can include 10 institutions.
While the text on the FAFSA does not ask the student to rank the student’s choice (i.e., which school is the student’s first-choice institution), the order a student lists an institution does appear to correlate to a student’s interest in that college or university. Consider the following results from campuses using Noel-Levitz financial aid services:
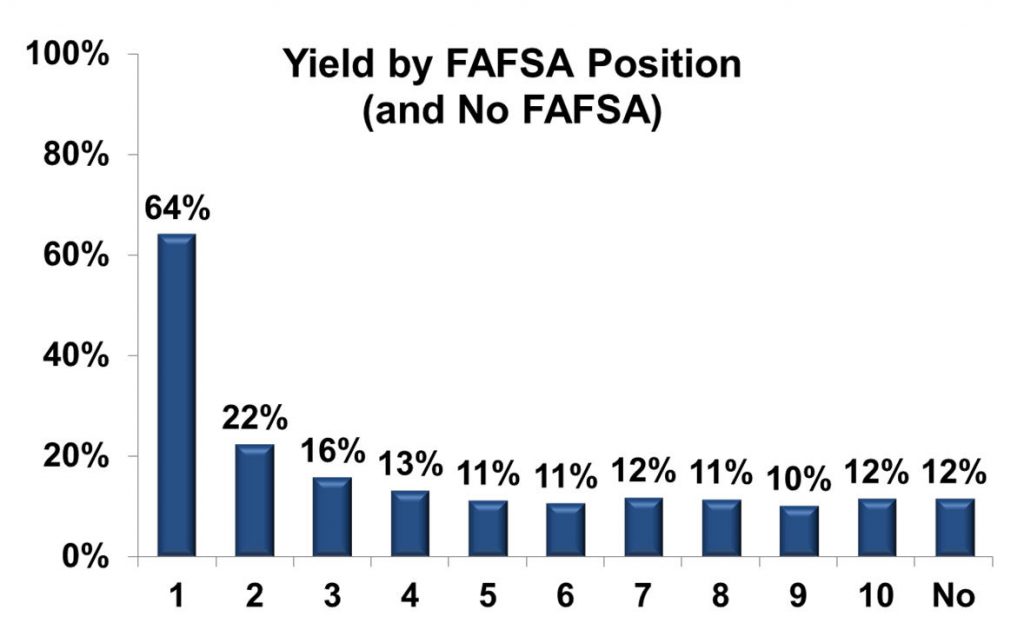
In an analysis of 153 of our campus partners, students enrolled at a 64 percent rate at the campuses listed first on their FAFSA. The yield dropped to 22 percent in position two and to 16 percent in position three. Students yielded at about the same rate in the remaining positions as those who did not file a FAFSA at all (12 percent). These trends were similar for both public and private colleges/universities.
There are caveats which need to be taken into account when analyzing this data. For example, for a Michigan student to receive a state grant in the state of Michigan, that school must be listed first. So a Michigan student who was leaning 90 percent toward a public institution in Ohio might still list a four-year public Michigan institution first and the Ohio campus second even though the Ohio institution is their top choice.
Also, students can make changes to their FAFSA application after their initial filing, and with each change, they might revise or even drop where a school is listed. When analyzing data, should you use data from the first or last transaction? We recommend the last transaction since it is the most up-to-date, but this means that there may be changes throughout the recruitment cycle.
The number of institutions listed is another consideration. The following chart shows an analysis of 95 colleges and universities that are Noel-Levitz financial aid clients and submitted all 10 FAFSA codes to us.
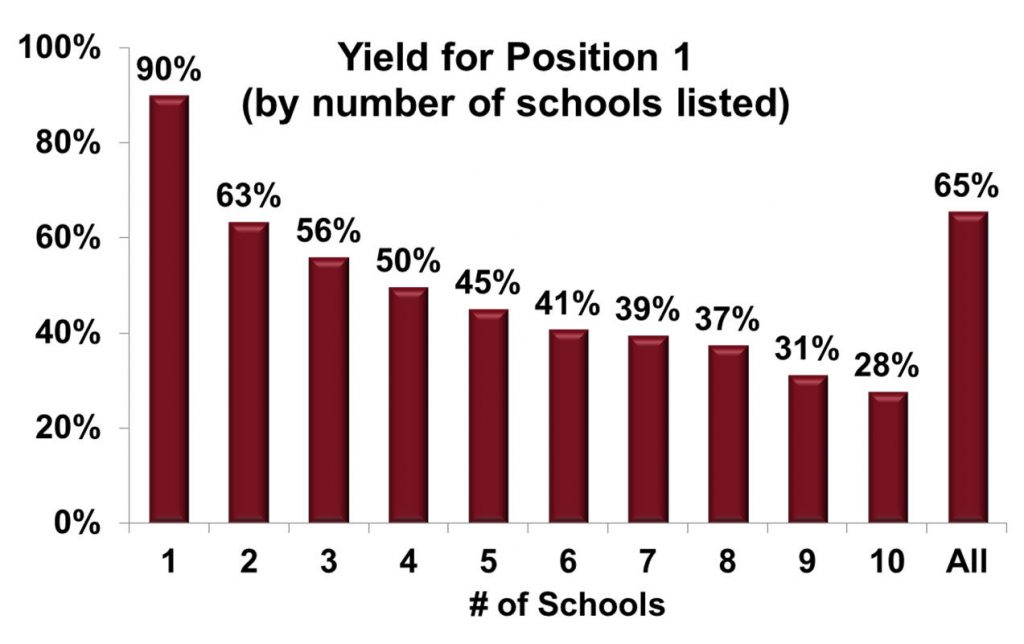
Students who listed one institution enrolled at that campus 90 percent of the time (the 10 percent who did not, despite listing only one campus, could have decided not to enroll at all or revised their FAFSA form). When they listed two campuses, 63 percent of students enrolled at the campus they listed first, dropping to 56 percent when three were listed, and so on. Even when there were ten institutions listed, yield for the first position was 28 percent, highlighting how strong that indicator is.
Note: With this sample of 95 institutions, the average yield for position 1 is 65 percent, slightly higher than the previous slide’s sample of 153 institutions.
Sharing FAFSA rankings: The source of the controversy
So far, there’s nothing controversial here, as yield rates tend to follow where the home institution is listed. The thing to keep in mind, though, is that each institution receives FAFSA data from the federal government in the form of the ISIR (Institutional Student Information Record), which also includes the school codes for all positions. With this data, the home institution knows what other institutions the student is considering and the relative position of the home institution to the competing institutions.
The controversy revolves around how campuses could use this information. (I’ll address how it should be used in a moment.) If students yield at higher rates when they list an institution in the first position, it is possible that the campus does not need to give students who list the institution first as much aid in order to get them to enroll. Similarly, if a student in position 10 has a much lower chance of enrolling, why even offer admission to them in the first place? Following this logic, if a campus does that enough times, then the admit-offers-to-acceptance rates can be improved, perhaps enhancing national rankings that use this rate as one of the criteria.
The thing to keep in mind, however, is that such practices are not standard and will not serve these institutions well in the long run. Furthermore, admissions officers at institutions that place a premium on acceptance ratios usually make offers much earlier than February when the FAFSA data are widely available. I am not trying to downplay the potential for abuse, but it is not in an institution’s best interest to use FAFSA data the way media reports have recently implied. Instead, there are very positive ways to use FAFSA rankings to benefit both the admissions process and students.
The benefits of FAFSA data for enrollment managers and students
By receiving FAFSA data in the ISIR format, it is simple to determine how often your applications cross with other institutions. In one extreme case among our campus partners, a private school had a cross-application rate of almost 50 percent with the in-state flagship public—meaning that half of the students who filed a FAFSA and listed the home institution also listed that public institution. In addition, another third of the home institution’s students listed another independent institution in the state. This provides this campus with a clear picture of its competition. They need to be very concerned about what these two schools are doing in recruitment and with their financial aid programs if they want to remain competitive. For most institutions, the competition is much less clearly defined. In only a small number of cases, the top cross application percentage exceeded 20 percent, and in most it was 15 percent or lower (as low as 5 percent in some cases).
This is important data for institutions, and they should monitor how the percentage of cross applications changes for their competitors each year. It can help you benchmark your recruiting and also identify competitors who may be moving into your territory. In addition, here are some other aggregate FAFSA metrics you should be following from year to year:
- Your yield rate in each FAFSA position
- Your average FAFSA position, so you can judge the strength of the admit pool from one year to the next (and the average position of your top competitors)
- The percentage of your FAFSAs where you are listed in positions one, two, or three
- What percentage of time you are listed in a lower position than your top competitors
- Your yield rate for all FAFSA filers compared to the yield rate for non-FAFSA filers
From an individual student recruitment perspective, the FAFSA position data is also very helpful. On weekly calls with my clients, we monitor a list of students who have the campus listed in the top three positions, but who have not yet deposited. If time needs to be prioritized (and it usually does), these are the students on whom the institution should be concentrating its efforts. But it is never the only means to prioritize time commitments. If a student has the home institution listed in position 10, but has recently inquired or visited, it is clear that this is a student who deserves a lot of attention. The list of other institutions the student listed on the FAFSA is also an entry point to a conversation concerning cost versus value—or the benefits of staying close to home, or the benefits of getting a bit further from home, or of class size, or selectivity, etc. It would be a shame if we lost the many positives this information provides enrollment managers, as they assess their place in the market, prioritize their student connections, and use it to help them find students who are good fits for their institutions.
A final note about using this data as a means to distribute aid. The financial aid division at Noel-Levitz has always been about determining each student’s appropriate level of aid to not only enroll that student, but also to retain them. This is not only good for the student, but academically and fiscally sound for the institution. If we were to use FAFSA positions in this process to lower aid offers, while it is possible there could be some financial savings in the short term, it could very well lead to students not receiving the aid they need over their entire collegiate career. A student may then have to withdraw, and the institution not only loses the student, but has to spend more to recruit a replacement. This is precisely why we take a more comprehensive view of awarding strategies when we consult with our campus partners.
I hope this post has clarified the value FAFSA data can provide in the awarding and enrollment process, and also demonstrated how this data can be used effectively and ethically. If you have any questions about this topic or other questions about the awarding process, please email me.