enrollment
Maximizing the Enrollment Impact of Your Media Spend Using Full-Funnel Attribution
According to a 2021 RNL survey of more than 100 graduate marketing leaders, between 2019 and 2021 the average digital marketing spend doubled. This reality was not surprising. Given the expected and continuing shortfalls in traditional undergraduate enrollment, institutions continue to pivot to the graduate populations to replace the lost revenue from the declines of the traditional student enrollment.
However, the increases in digital advertising spend do not necessarily guarantee results. The digital space is crowded with your competition and various channels. Paid search, Meta, LinkedIn, TikTok, and other channels provide digital marketers with what seems like endless opportunities to tell their stories. Digital marketing is not hard, but executing a strategy that drives enrollment (the only stage that generates revenue) is challenging.
Having clear insight into prospective student behaviors and how those behaviors affect the performance of everything institutions are doing to “keep them in the funnel” is quickly becoming a key to success. At RNL we call the route to these kinds of insights Full-Funnel Reporting.
Winning in digital marketing is also made more difficult by the following demographic challenges
- After three years of unprecedented growth, fall 2022 graduate enrollment data showed slight year-over-year contraction (-1.2%). Growth is still projected, but at lower rates.
- Undergraduate enrollment continues its contraction, albeit with lesser year-over-year losses in fall 2022 (.6 percent). Demographics will continue this trend for most of the coming decade.
- Graduate students are more likely than ever before to be applying to multiple programs, and more schools are adding graduate programs every day, adding to the competitive situation.
What does this all mean? Do institutions need to invest more in graduate education? Possibly, but perhaps of even greater importance is ensuring that you can assess the ROI of every dollar and action taken with existing funds. The only way to truly measure the effectiveness of your digital marketing efforts is tracking through full funnel reporting.
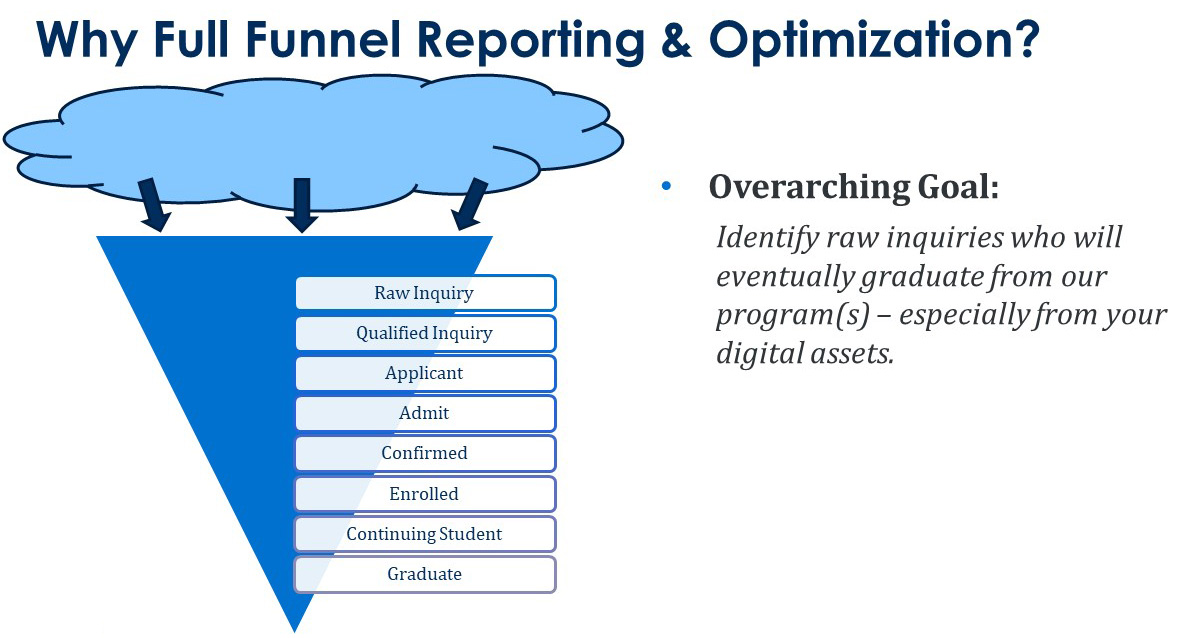
Full-Funnel Reporting refers to the process by which institutions track the relative success of various lead sources and channels in producing enrollment. Even more sophisticated reporting systems track the success of students with completing their programs of study.
“Which of your lead sources performs best?”
Do you know the answer to this question? If you do, does that mean you know which lead sources result in the most program graduates? In many conversations, my colleagues who work with graduate and online programs find that the answer is “I don’t know”, or something less than a definitive answer, perhaps knowing that X source results in more applications than Y source. But with a full-funnel reporting system, campuses can dig deeper. Imagine being able to track lead to enroll rates for channels like Meta and paid search. In addition, many RNL campus partners can track those same rates by the campaign and the creative.
If the goal of the most sophisticated marketing operations is to be able to identify the inquiry sources that most frequently enroll and graduate (particularly among digital sources that so much of a marketing budget), then campuses need a way to track lead sources—and the money spent on each of them—through to enrollment and graduation.
But lets start simple. A full-funnel attribution system like RNL Envision allows you to answer each of these questions:
- What ads/campaigns are generating the most clicks?
- What ads/campaigns are generating the most inquiries?
- What ads/campaigns are generating the most conversions to applicants?
- What ads/campaigns are resulting in the most enrollments?
- What ads/campaigns are producing the most graduates?
- Which ad sources see the optimal cost per click/per conversion?
- Which ad sources see the best cost per enrollment?
- Through what sources and channels are we
What Full-Funnel Reporting looks like
Summary Dashboard
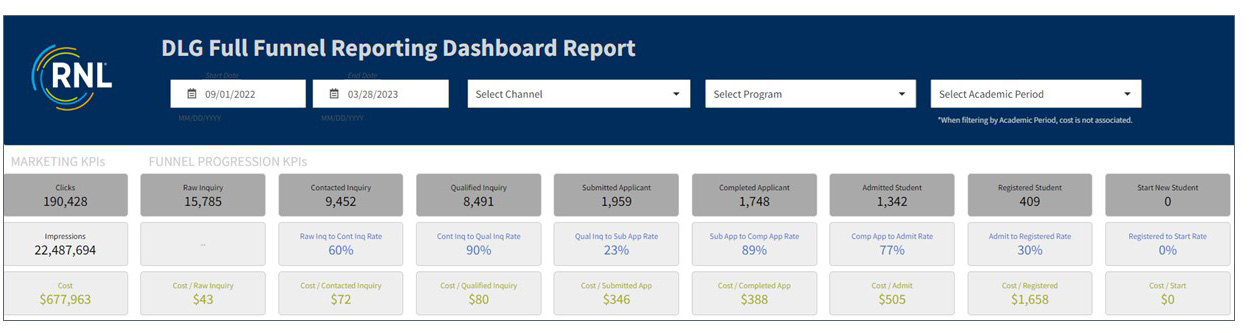
It all starts with a dashboard. What is your spend and how is that spend performing at each stage of the funnel: clicks, inquiries, qualified inquiries, applications, admitted students are more. But this is just the first step.
Performance by Channel
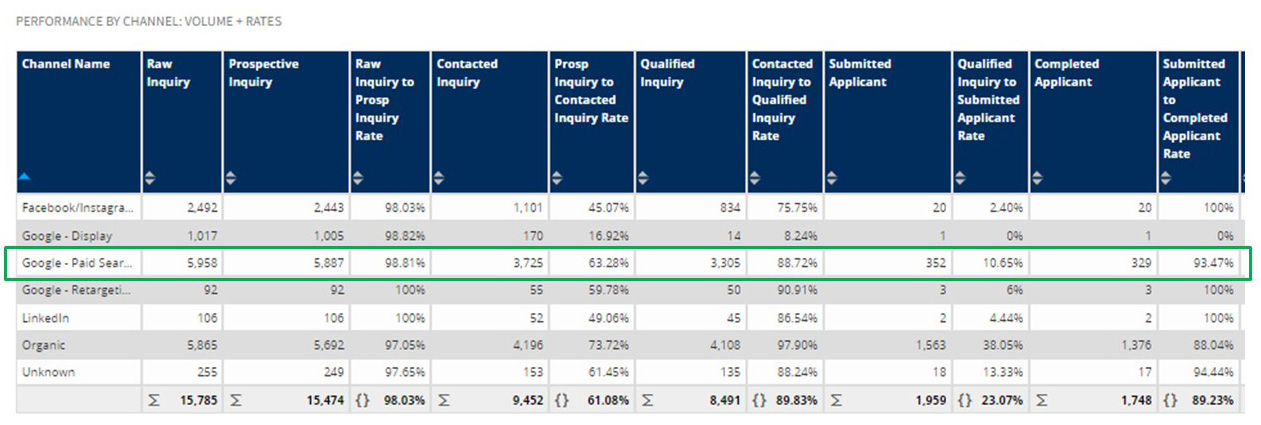
This data allows you to drill down to the individual channels and can be where quite interesting. For each of those stages, the “performance by channel” dashboard allows the user to assess how each channels being used is performing—over time and at this moment in time. For example, one channel might be really effective at driving a high volume of leads with a low cost per lead (CPL). However, if that channel isn’t performing in driving enrollment, it would be prudent to look for opportunities to redistribute media dollars to channels that perform better.
Performance and Cost
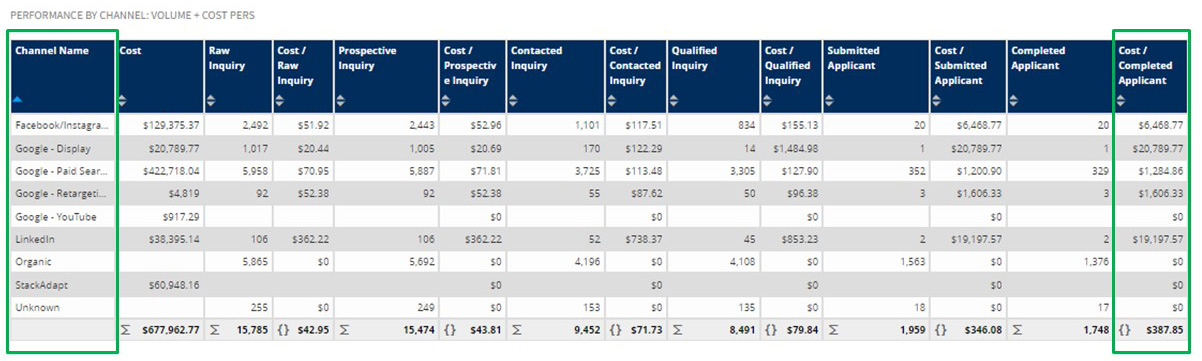
You’ve seen the volume performance by channel, but how do these numbers relate to marketing dollars spent? This visualization allows for strategic discussions about the channels being used. It illustrates the immediate ROI of leads generated as well, along with a longer-term view of how leads from each channel result in applications (in this instance) and enrollments.
Performance by Program: Volume and Cost
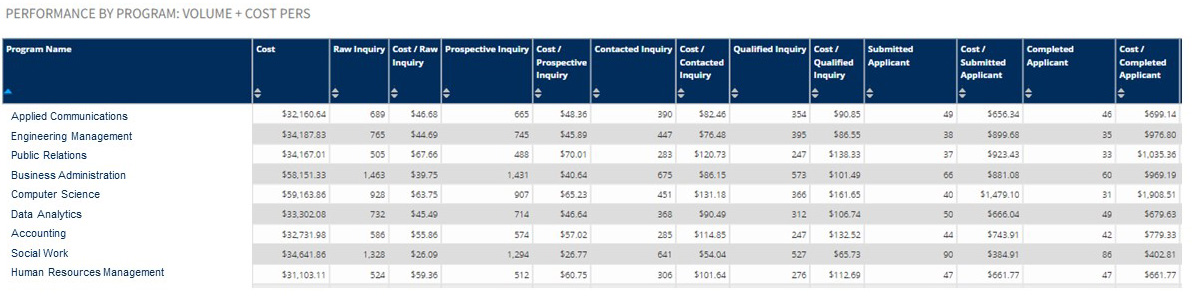
Moving from the discussion of channels to how those channels support enrollment for each program allows for other strategic conversations. We start with the money spent on each program (and can drill down to see the channels used for each), and then can assess the relative performance of campaigns for each program included in the system. While all the columns have great value, perhaps the most important are some combination of the last—cost-per-completed application and the preceding column completed applications,” which both show the overall success of efforts. In a full-funnel attribution instance, these columns would extend to enrollment and cost per enrollment.
Full-funnel data make a number of difficult actions much easier
- You can assess which programs enroll and graduate students in the largest numbers with the most efficient marketing spend.
- Similarly you can identify those programs for which the spend may be high, but the lifetime “return” of graduates is the highest.
- You can identify program areas in which even at a high spend are not resulting in enrolled students or graduates.
- You can assess which channels are working—at the program level—best to recruit students who enroll (and even graduate). ]
- You can analyze—in real time—the channels that are performing best at each stage and increase spend on those that are working best and decrease spend on those that aren’t.
Find out more about Full-Funnel Reporting and maximizing your recruitment
Talk with our experts about how you can use Full-Funnel Reporting with RNL Envision to optimize your media spend, increase leads and ROI, and reach your enrollment goals. Reach out to our graduate and online experts for a complimentary consultation.
About the Author

Scott Jeffe has worked with more than 200 institutions in 40+ states to apply market data to strategic decisions. With a focus on profiling the demands and preferences of nontraditional (adult, online, etc.) students, Scott...
Read more about Scott's experience and expertise
Reach Scott by e-mail at Scott.Jeffe@RuffaloNL.com.