enrollment
LinkedIn Rolls Out Flowchart Reporting for Conversation Ads

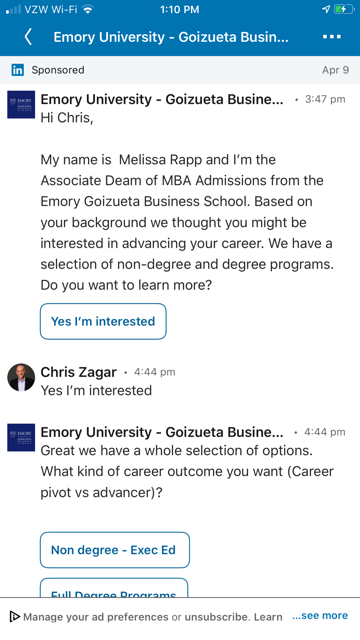
It has been a few months since LinkedIn formally launched Conversation Ads. This new ad type offers a blend of Message (InMail) Ads and a user experience similar to that of a chatbot where recipients are able to choose from a list of pre-determined options prompting multiple conversion paths.
This new format, coupled with the ability to pair LinkedIn Lead Generation Forms, has already proven to boost engagement and conversion while simultaneously lowering Cost Per Lead (CPL). Here’s an example of how it works.
LinkedIn Conversation Ad reporting falls short
At the time of launch, LinkedIn did not expand their out-of-the-box reporting for the new ad type. You could use the pre-built Performance and Sponsored Messaging columns, but there was no way to view how recipients were interacting with your ad and where they were dropping off throughout the automated conversation.
The only data that LinkedIn did provide that would help you gauge performance and/or engagement with the ad was Button Clicks. This metric provides the total the number of clicks for all buttons included in your Conversation Ad, but does not breakdown the performance of each button—crucial for campuses that want to test different calls to action within an ad. This reporting shortcoming left many requesting LinkedIn to expand reporting for the new ad type.
Accessing the new Flowchart reporting
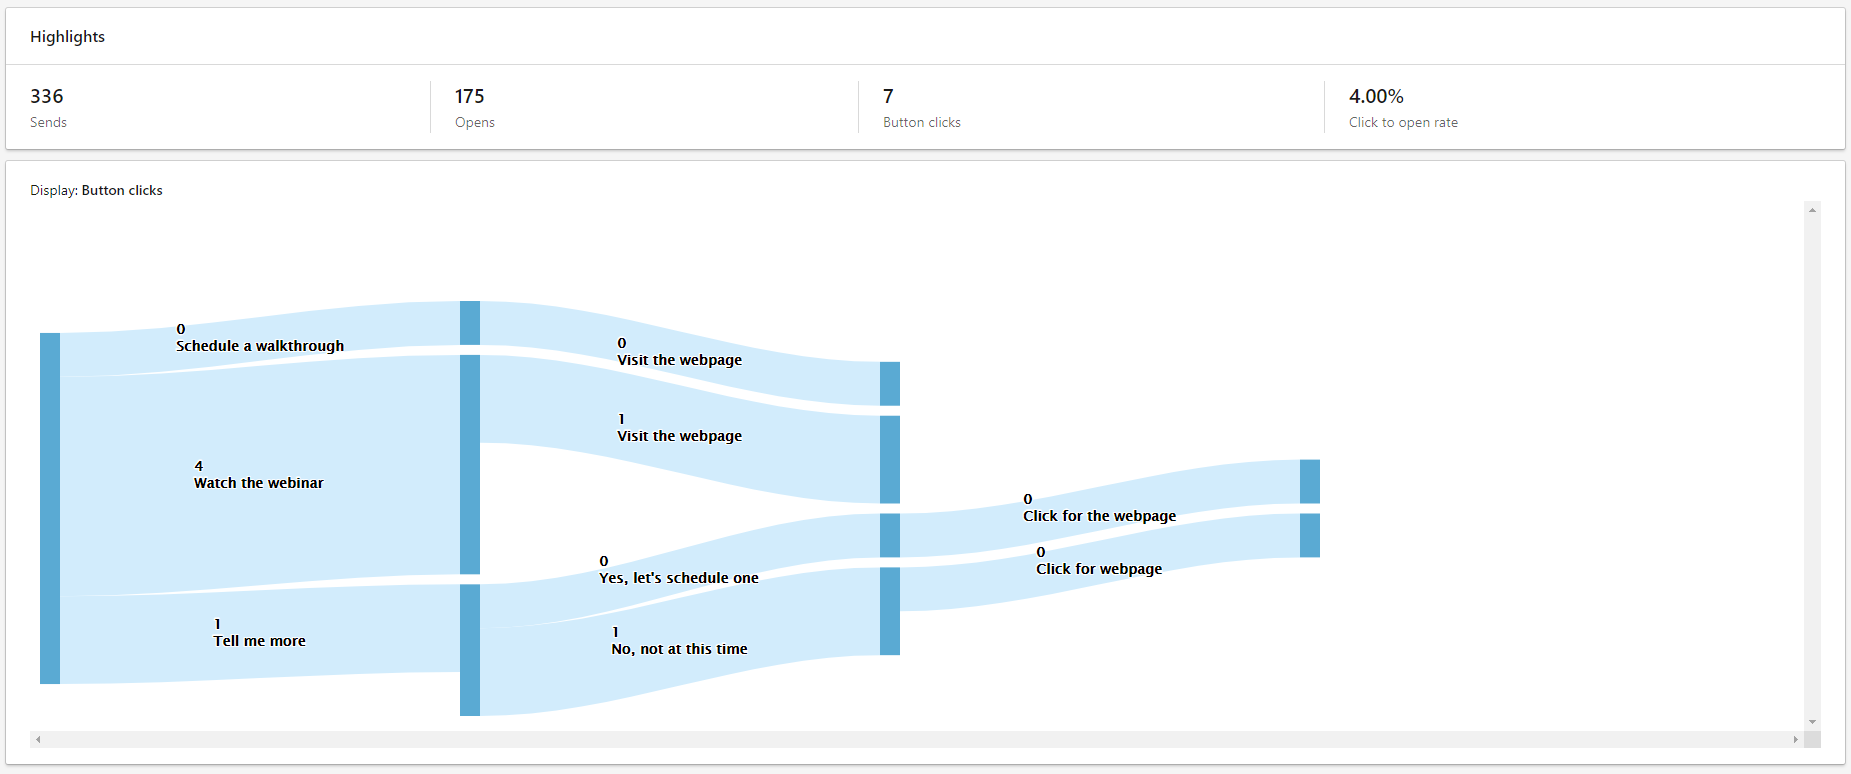
LinkedIn just recently announced increased reporting capabilities for Conversation Ads with the addition of the Flowchart report. This report, comparable to appearance of the Behavior Flow report in Google Analytics, shows the breakdown of button clicks in your ad by step.
Here is how to view the report:
- Login to LinkedIn Campaign Manager
- Choose your Account and Campaign Group
- Select the Conversation Ad campaign and ad that you want to view
- Click on “Flowchart” towards the top of your screen
It is important to note that this report can only be accessed at the Ads level within LinkedIn Campaign Manager and can only be viewed if an active ad is selected. The Flowchart button, located next to the Performance Chart and Demographics report towards the top of your screen, will be grayed out until you select a specific ad.
I hope this blog will help you gain more insights into LinkedIn Conversation Ads. If you have any questions, please feel free to reach out to me.
Talk with our digital and enrollment experts
We’re to help you find the right digital marketing and recruitment strategies. Let’s set up a time to talk.
About the Author

Merrik Kressley is an experienced digital marketing professional with a wide range of expertise in digital strategy development, SEO, PPC, CRO, Conversational Marketing, analytics, email, automation, and attribution and reporting. As Digital Marketing Manager, he...
Read more about Merrik's experience and expertise
Reach Merrik by e-mail at merrik.kressley@ruffalonl.com.