student success
National Student Satisfaction Assessment: Understanding the Perceptions by Demographic Variables
Did you know the satisfaction levels of your different subpopulations on campus can vary? Not all students are as satisfied as others.
For years, in working with individual campuses to help them understand their student satisfaction assessment results, I have observed differing satisfaction scores for student subpopulations on a campus-by-campus basis. For example, when I see more females in a data set, I know the satisfaction levels are more likely to be higher.
I have shared these observations with campuses anecdotally to guide them in their review of their results, their understanding of the comparison with the national data, and in helping them to think about intentional activities to improve satisfaction in key populations.
I am excited to share that this year, the 2018 National Student Satisfaction and Priorities Report looks at the national satisfaction levels for key subpopulations to provide insight into how various subpopulations may influence overall satisfaction levels. Understanding which students are less satisfied on the national level can help you target initiatives to similar student groups on your own campus, improving student satisfaction and ultimately student success for specific populations.
The power of institutional choice perceptions in student satisfaction assessment
We have consistently seen that students who say they are attending their first-choice institution have significantly higher levels of satisfaction. This is true across institution types serving traditional-age students:
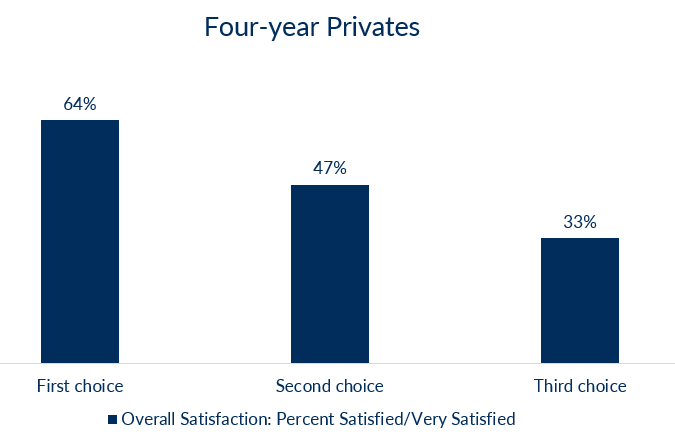
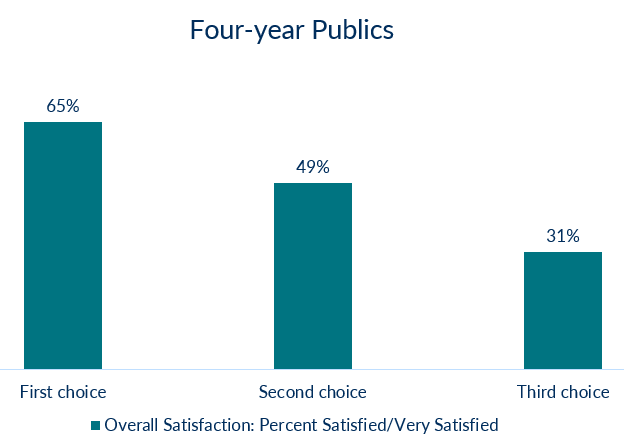
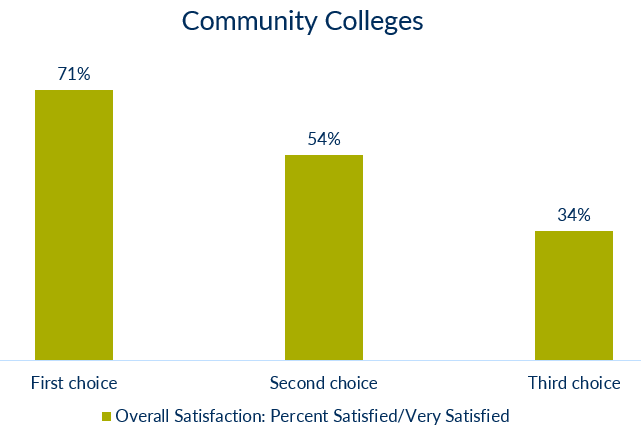
What these charts reflect is that only one-third of students attending their third-choice institution identify themselves as being satisfied or very satisfied with their experience. The majority of these students indicate that they are dissatisfied.
This year’s report also highlights the link between institutional choice perceptions and the corresponding satisfaction levels with items related to campus climate. The satisfaction scores for these items, which reflect how students feel on campus, have also been correlated with individual student retention and institutional graduation rates. How students feel on campus can make a big difference in whether they choose to stay, transfer to another institution, or drop out. These items are even more critical when it comes to lower satisfaction levels among students who perceive the institution to be their second or third choice. The combination of low satisfaction on these items along with the perception of not wanting to be at the institution can make students more vulnerable to leaving.
The good news is that institutional choice is a demographic variable that colleges and universities may be able to influence, with recruitment messaging, engagement building, and positive on-campus messaging. When campus leadership understands the impact that institutional choice has on campus perceptions, opportunities to change the way students are recruited and re-recruited can be implemented.
Satisfaction levels for other demographic populations
In addition to examining student satisfaction by institutional choice indicators, this year’s report also slices the national data by:
- Race/ethnicity
- Class level
- Gender
- Age
- Employment
- Current residence
- Class load
- Educational goal
These variables were reviewed separately for different institutions: four-year privates, four-year publics, community colleges, and institutions serving adult undergraduates, graduate students, and online learners. They data points answer these questions:
- How does satisfaction vary by class levels?
- How does satisfaction change across race/ethnicity?
- Are younger or older students more satisfied?
- Are students enrolled primarily online more satisfied than students enrolled on campus?
Understanding which populations have higher and lower satisfaction overall can point campuses in a direction to more deeply explore unique experiences with campus climate, instruction, registration, financial aid and other campus services for potential improvements.
Download the full report and see how student satisfaction assessment can benefit your campus
 I encourage you to download this year’s National Student Satisfaction and Priorities Report and to consider how you can work on your campus to improve satisfaction for particular demographic populations of your students.
In addition, take a look at our 2017 findings to learn where students said their experiences could be improved.
If you are not currently surveying student satisfaction on your campus, consider adding student satisfaction assessment to your activities to provide the student voice to your student success efforts. The RNL Student Satisfaction Inventory has been taken by more than 5.5 million students at 2,700 campuses, and the RNL Adult Student Priorities Survey and RNL Priorities Survey for Online Learners are also used by a wide variety of institutions. Learn more about the RNL Satisfaction-Priorities Assessments.
About the Author

Julie L. Bryant, vice president for student success at RNL, works directly with colleges and universities throughout North America in the area of satisfaction assessment. Julie is responsible for client service to more than 2,700 institutions...
Read more about Julie's experience and expertise
Reach Julie by e-mail at Julie.Bryant@RuffaloNL.com.