enrollment
3 Stats That Signal the Transformation of Higher Education
In a November 2022 blog, I presented some high level findings on the differences between IPEDS data on 12-Month Unduplicated Headcount numbers (“12-Month data”) versus IPEDS Fall Snapshot numbers (“Snapshot Data”). Snapshot Data are used by almost everyone in higher education to help understand trends and dynamics.
While the November blog indicated that Snapshot Data undercounted total enrollment by nearly 6 million students in 2019 (the last pre-pandemic year), I didn’t go too far into where these missing students were hidden. This can all be found when you look at those enrollment differences by instructional format chosen by students. Where they are found is just one of the three statistics that I believe are key indicators of the transformational change that is afoot in American higher education.
1. “Undercounted” students are almost ALL online or hybrid students
When comparing 12-Month Data with Snapshot Data, IPEDS is undercounting total enrollment by more than 5.6 million undergraduates and more than 820,000 graduate students. The vast majority of these uncounted students chose to enroll in either all online courses (1.8m undergraduates and 445k graduate students) or some online courses (3.2m undergraduates, and 380k graduate students.)
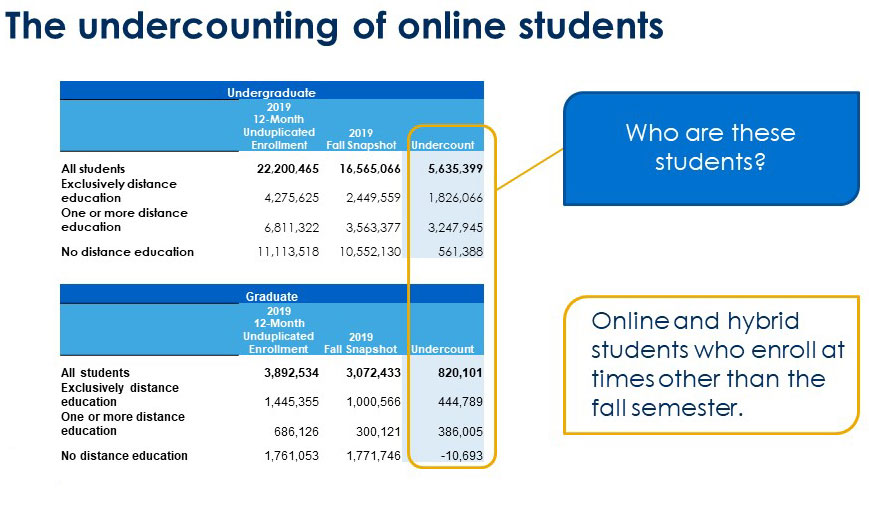
Let’s think about why they went uncounted. The Snapshot Data are a reflection of numbers of students enrolled on a given day (I believe in October) of every school year. If you aren’t enrolled at that point, you are not counted. So this implies that the uncounted 6+ million students enrolled at some other point in the year.
Implication: The huge implication for higher education institutions is that if you don’t have additional times each year—with robust recruitment efforts throughout the year—you have no chance to get your “share” of these uncounted students.
2. Enrollment patterns did not “snap back” in 2021
As much as commentators and experts have indicated that the pandemic would be a transformative event, dozens of people have told me that they were expecting a relatively quick return to “normal” regarding student instructional format choices. What was the basis for that prediction? A dozen variations of “the remote learning experience was so bad that our students are craving pre-pandemic style learning.”
However, with fall 2021 Snapshot Data finally available, it’s clear that there was no snapping back to “normal” enrollment patterns as they relate to instructional format. By fall 2021, the majority of institutions were back on campus with safety precautions in place. But the data show that—in the aggregate—the students just didn’t show up the same way. (I’ll report on 2021 12-month data later.)
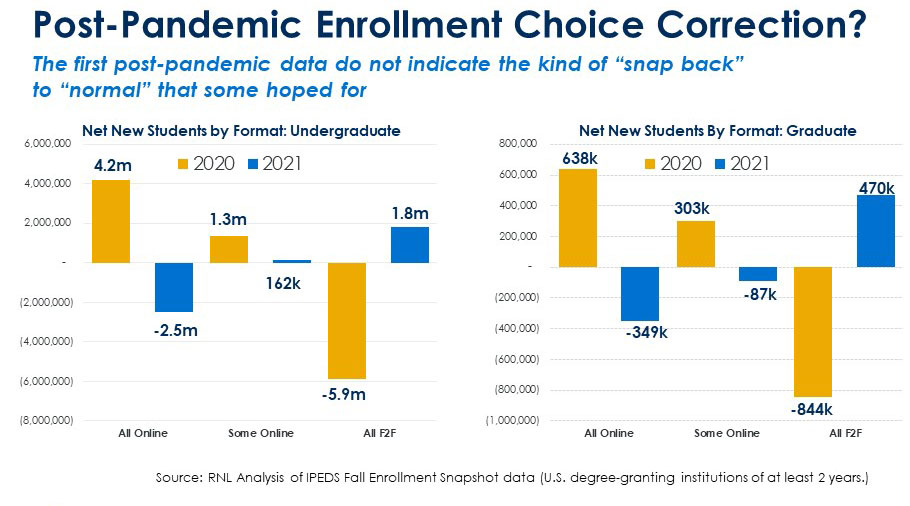
Fall 2020 saw 5.9m fewer undergraduate classroom students, but only 1.8m (not all 5.9m) returned to all-classroom study in fall 2021. At the graduate level, fall 2020 saw 844k fewer all-classroom graduate students, but only 470k returned to the classroom in fall 2021. The balance of students at both levels (noting overall undergraduate enrollment contraction continuing in 2021) decided to stick with either all online study or enrolling in a mix of online and classroom courses.
Implication: While some institutions will have experienced the kind of “snapping back” to normal that was hoped for, many more institutions may have been caught off-guard with all-classroom enrollment numbers in 2021. Cazenovia College in New York is just one such institution that had to make the hard choice to shut down permanently when (after struggling for many years) the incoming class in fall 2021 was smaller than ever.
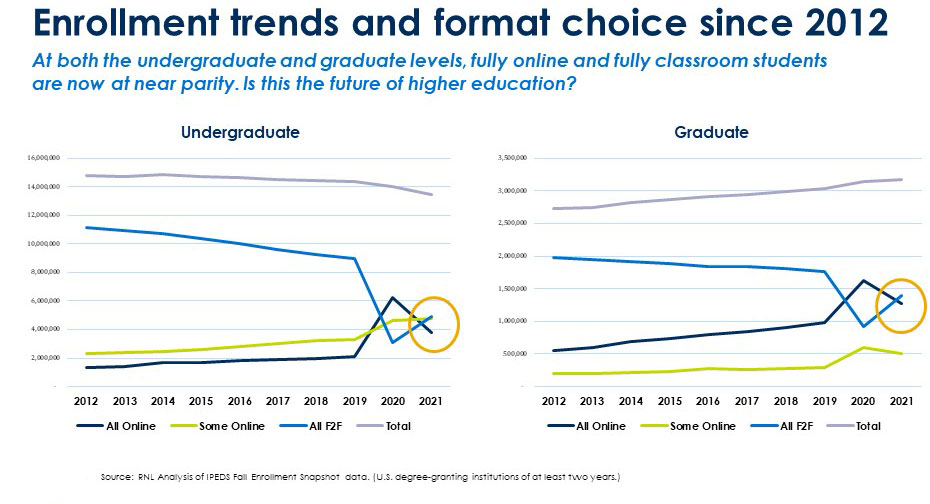
3. Classroom, online, and partially online enrollment have reached parity
Long-term trend lines portraying student choices of all classroom, some online, and all online study show that in 2021 nearly as many students decided to enroll in all online courses as all classroom courses—with an approximately equal number of undergraduates choosing to enroll in some online.
These new data may indicate that the undergraduate and graduate degree markets will return to their pre-pandemic trends, which were seeing slowly increasing participation in all-online education and slowly declining participation in all-classroom education. But, this hypothesis doesn’t take into account what I call the “try it you’ll like it” factor in human behavior. The real X-Factor in determining what will happen in the future is the proportion of students that, having tried online or even emergency remote learning, have been convinced that the advantages (flexibility, convenience, etc.) outweigh the disadvantages.
My own hypothesis based on more than 20 years of interviewing, surveying, and “focus grouping” students age 25 and over is that the “try it you’ll like it” instinct is strong. Over these 20 years, I have repeatedly heard, “I am curious about online, but I haven’t ever done it.” Well, millions of students have now experienced it. With this in mind, I think we may see a plateauing of demand, with online, partially online, and classroom demand being relatively equal as the traditional audience shrinks and institutions are forced to focus on alternative student audiences in order to make up enrollment gaps.
Implication: For most institutions, a growth strategy has gone from seeing the availability of fully online programs as a “nice to have” to a “must have.” Further, institutions that have online programs but are reluctant to allow their classroom students to enroll in online courses are going to have to quickly reconsider this policy. There are all kinds of implications in this, not least of which institutions should standardize their pricing for classroom and online courses.
Next month we will be looking at the demographic shifts that are most likely to be important as institutions continue to refine their long-term strategies. Did you know that RNL now offers online instructional design services, digital marketing solutions, recruitment/cultivation services, market research studies, student journey mapping, and more? Unlike an OPM, everything we do is transparent and owned by you. Contact us today to find a time to talk about your needs.
Transform your success with graduate and online enrollment

Find out how RNL Enable can support your graduate and online enrollment across the student lifecycle:
- Strategy and Market Research
- Instructional Design
- Lead Generation and Enrollment
- Student Success and Completion
About the Author

Scott Jeffe has worked with more than 200 institutions in 40+ states to apply market data to strategic decisions. With a focus on profiling the demands and preferences of nontraditional (adult, online, etc.) students, Scott...
Read more about Scott's experience and expertise
Reach Scott by e-mail at Scott.Jeffe@RuffaloNL.com.