enrollment
How Much Have We Been Undercounting Online Students?

Having focused on the returning adult student for more than 20 years, I have often thought that 12-month (academic year) unduplicated headcount data better portray adult student participation in higher education than the fall snapshot data that is commonly used to understand of the “shape” of the market. Why? Because online and graduate students are less committed to starting in the fall.
This was the topic of an excellent blog post on the PhilOnEdTech blog. In the post, Phil Hill reported that 12-month unduplicated headcount data is now available by modality (all distance, some distance, and no distance) and his analysis is excellent. It spurred me to interview him about the intersection of these data and the ed tech sector. I encourage you to read his blog and to listen to my interview with Phil.
What the data show
The fall enrollment snapshot that we have relied on is undercounting online student by 75 percent among undergraduates and 44 percent among graduate students. Below we summarize the topline data and at the end of this blog we present more detailed data by sector of institution using 2019-2020 academic year data (rather than 2020-21 which saw dramatic change due to the pandemic). Here’s what we found:
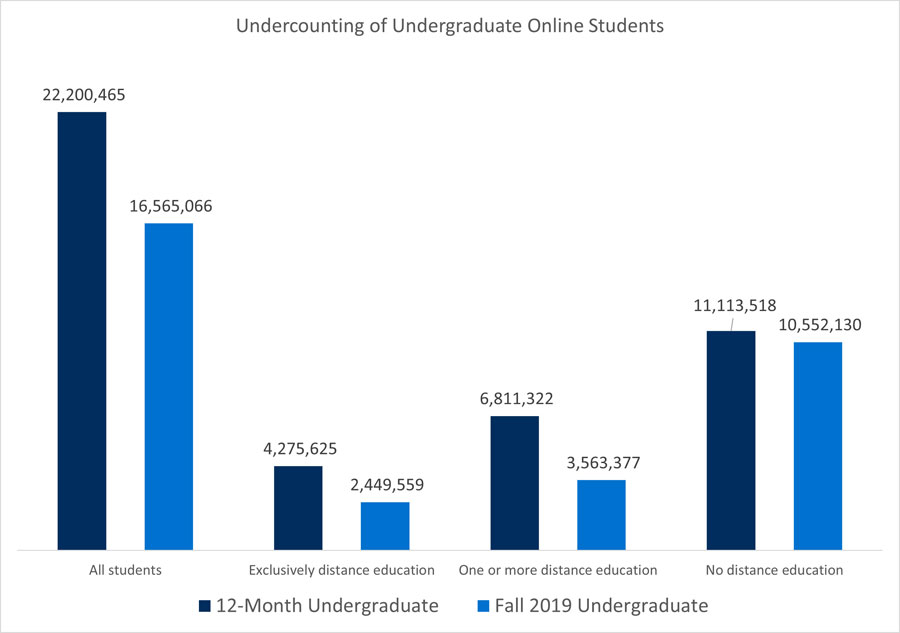
Undergraduate: Among undergraduate students enrolling in all formats of study, fall snapshot data undercount total enrollment by 34 percent (missing 5.6 million students), and the undercount grows to 75 percent for fully online students (missing 1.8 million students.) Other findings include:
- Fall snapshot data (fall 2019) missed a total of 5.6 million undergraduate students across all formats.
- Only 10 percent of these additional students were enrolled in all classroom courses.
- Public institutions account for 77 percent of all the fall snapshot numbers and 74 percent of the additional students, so that is pretty consistent.
- Private non-profit institutions comprise 17 percent of fall totals (all formats), but only 10 percent of additional students. They also report having fewer total students over the course of the year than what is being reported in fall snapshot (so there may be over confidence in the strength of fully classroom delivery at our private non-profit institutions).
- For-profit institutions account for 5 percent of fall snapshot totals but gain 15 percent of the additional students from 12-month data. These institutions are the only types to see great growth in the all classroom program numbers—an additional 458k students (compared with an additional 324k fully online students).
Graduate: Among graduate students enrolling in all formats of study, fall snapshot data undercount total enrollment by 27 percent (missing more than 800,000 students), and the undercount grows to 44 percent for fully online students (missing more than 440,000 students.) Other findings include:
- 12-month data reveal more than 820,000 additional graduate students across all formats.
- The entirety of the missing 820,000 students enrolled in either all online courses or some online courses. No additional students enrolled in only classroom courses.
- The fully scrubbed 12-month data indicate that there were 10,693 fewer students who enrolled in only classroom courses. Both publics (-5,571) and non-profit privates (-8,230) had fewer classroom-only students than captured in the fall data.
- Public institutions enrolled 49 percent of all graduate students in the fall snapshot data and gained 42 percent of the additional students in 12-month data. The total share of students enrolled in only classroom courses dropped from 63 percent in the fall data to 51 percent in the 12 month data.
- Private non-profits enroll 44 percent of graduate students in the fall snapshot and gained 42 percent of the additional students. The total share of students enrolled in only classroom courses dropped from 60 percent in the fall data to 44 percent in the 12-month data.
- For-profit institutions enrolled 8 percent of graduate students in the fall snapshot but gained 16 percent (an additional 132k students) of the additional students. Almost all of these additional students (115k) enrolled in all online courses.
Why is this important?
We have long-known that the opportunity for enrollment growth has been among student who choose to enroll in either a fully online program or a program that offers both online and classroom courses. What we didn’t know is that the magnitude of demand is even greater than we thought. When you consider that the data that is regularly presented in reports and presentations across the country missed 5.6 million undergraduate (all but 561,000 of whom opted to enroll in online courses) and 820,000 graduate students (all of whom opted to enroll in online courses), the necessity of institutions expanding their online reach becomes even clearer than before.
When you consider the detailed data by institution sector/type, which indicates that fall snapshot data is actually over-counting the numbers of students who enroll in classroom-only courses, there are implications for near-term (let alone long-term) institutional health that cannot be ignored. But institutions cannot take on every aspect of an online growth strategy on their own. Strategic decisions need to be made regarding what they should invest in internally—to grow their own capacity to service these students—and what they should outsource so they can continue to do the things that are most critical in effectively and efficiently serving their students.
RNL can help. Our RNL Enable solutions are customized for each institution to fill in the gaps that the institution does not have internal capability (at this moment in time) to take on. Every institution is different and therefore every solution is different. Contact us today for a complimentary consultation and learn why you will want to join the growing list of schools working with RNL Enable.
Transform your success with graduate and online enrollment

Find out how RNL Enable can support your graduate and online enrollment across the student lifecycle:
- Strategy and Market Research
- Instructional Design
- Lead Generation and Enrollment
- Student Success and Completion
About the Author

Scott Jeffe has worked with more than 200 institutions in 40+ states to apply market data to strategic decisions. With a focus on profiling the demands and preferences of nontraditional (adult, online, etc.) students, Scott...
Read more about Scott's experience and expertise
Reach Scott by e-mail at Scott.Jeffe@RuffaloNL.com.