enrollment
Enrollment Format Choices: Snapping Back to “Normal”?
“What do you think is going to happen?” This has been the unasked question that has been on everyone’s mind over the last three years. (It is hard to believe that in a matter of days it will be three years since the Covid-19 pandemic began!) We’ve been watching and waiting, adjusting and amending, and my institutional colleagues have been more nimble than they ever thought they could be.
But I sense in many of the people I talk with a wish that things would “get back to normal.” It is a human condition, as common as hoping for a bright sunny day in February.
The data are in
IPEDS Fall 2021 Snapshot Data, like so many other things this past year, suffered from the “supply chain shortage” and were more than four months late in being published. But we finally have the data points, and there are three things that are crystal clear:
1. Undergraduate students did not return to classroom settings in Fall 2021.
In the chart below, we see that while 4.2 million additional undergraduates were pushed into all online (or for many “emergency remote”) courses in fall 2020, only 2.5 million decided not to continue in this format in fall 2021. Further, only an additional 1.8 million undergraduates made the decision to enroll in all face-to-face (F2F) classroom students in 2021, after 5.9 million of them had left fully classroom study in 2020. (See left side of visualization below.)
Another point of concern is the gap between the 2.5 million fewer all online students in 2021 in comparison with only 1.8 million more classroom students. A number of these students enrolled in the “some online” category, but others did not return, leading to a continuation of the contraction in undergraduate enrollment.
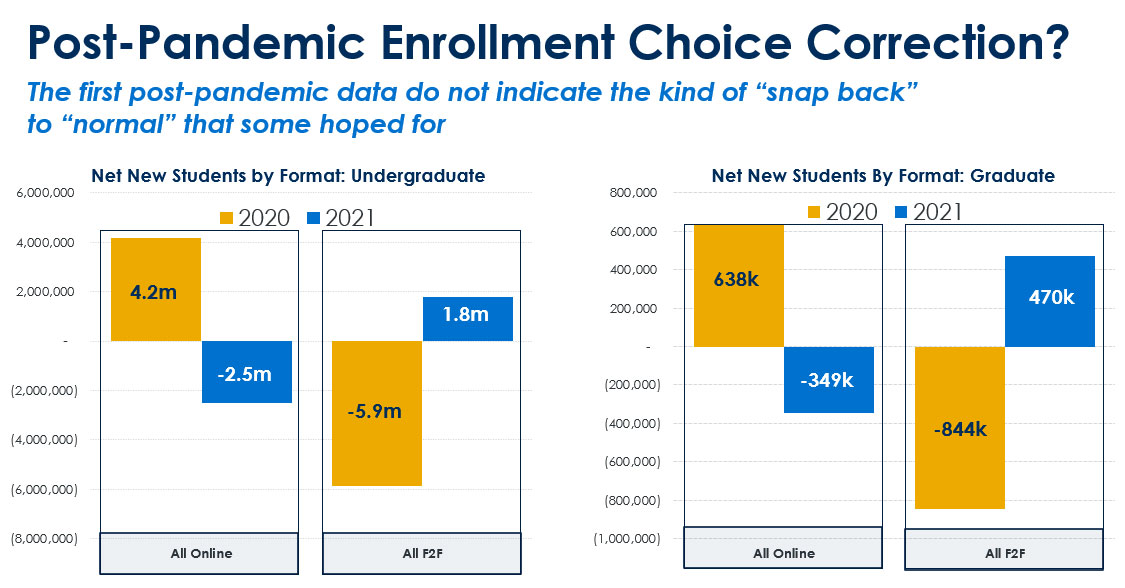
2. Graduate students were far more likely to return to their pre-pandemic format in 2021.
In the chart above, we see that while 638,000 additional graduate students were pushed into all online (or “emergency remote”) courses in fall 2020, only 349,000 of them decided not to continue in this format in fall 2021. In fall 2021, an additional 470,000 graduate students decided to enroll in all F2F classroom courses, after 844,000 had migrated away from all classroom study in 2020. In our the visualization in item 3, we will see that this brought graduate enrollment back into much closer alignment with pre-pandemic trends than at the undergraduate level.
Talk with our graduate and online enrollment experts
Ask for a free consultation with us. We’ll help you assess your market and develop the optimal strategies for your prospective graduate students and online learners.
3. The pandemic is likely to have had a far more lasting effect on undergraduate students’ format choices than graduate students’.
In order to assess the new 2021 data in comparison with pre-pandemic trends, I calculated the compound annual growth rate (CAGR) between 2012 and 2019 for each of the formats students are choosing. I then used that percent to plot where 2020 and 2021 enrollment may have been (barring any other significant impact). Here’s what I found:
Undergraduate: Prior to the pandemic undergraduates who chose to enroll in all online courses had been growing by 6.5 percent per year, while those who chose to enroll in all F2F classroom was declining by 3.1 percent per year (and those who chose to enroll in some online courses was growing at 5.1 percent per year). Projecting enrollment using these pre-pandemic rates produced the three dotted lines in the chart below. (See left side of the Enrollment Trends and Format Choice visualization for undergraduate trends.)
It is clear that without the pandemic, a wide gap would remain for the foreseeable future between those who chose all classroom and those who chose all online courses. That gap stood at more than 6.8 million students in 2019. Instead, the actual data show a confluence of the three lines that may result in some sort of plateau now that almost every student has tried online (and an as yet unknown percentage decide that the benefits outweigh the disadvantages. In fact, in 2021, just 1.1 million more student chose all classroom courses over all online.
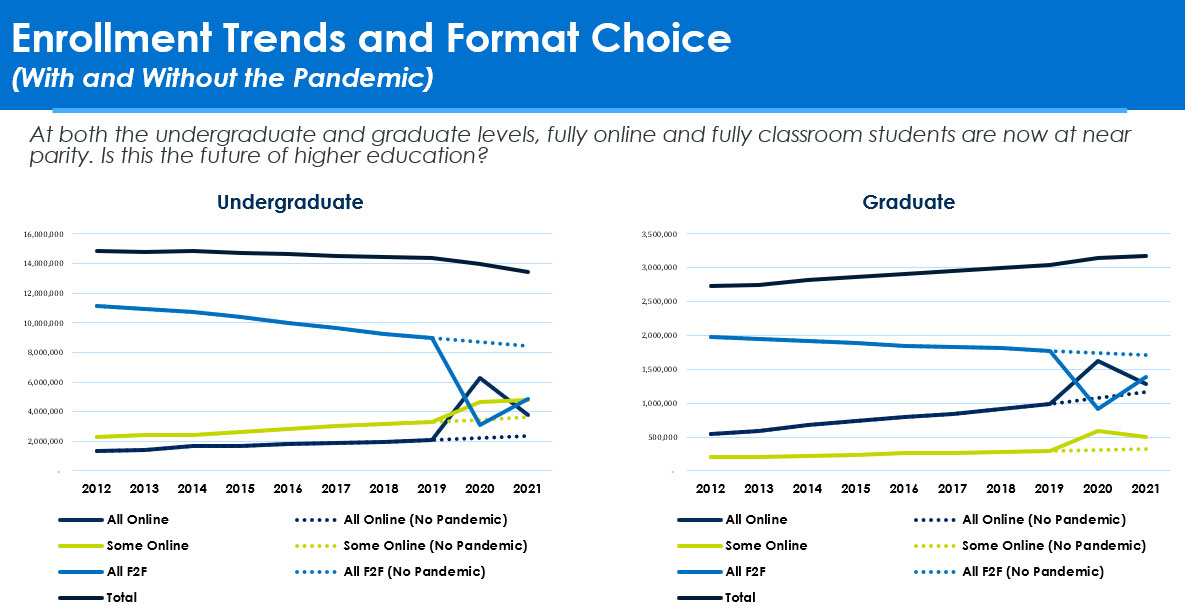
Graduate: Prior to the pandemic, graduate students who chose to enroll in all online courses had been growing at 8.8 percent per year, compared with contraction of 1.6 percent per year among students enrolling in all F2F classroom courses. Graduate students choosing to enroll in some online courses had also been growing, but at about 5 percent per year and with total numbers well below students in either of the other formats.
The proportions of the graduate market were well on their way to converging prior to the advent of the pandemic with just 776,000 students separating those who enrolled in all classroom and those who enrolled in all online. While this would have taken between 5-6 years at pre-pandemic rates, the pandemic accelerated these trends and in Fall 2021, online and classroom students were at near parity (with just 113,000 more students choosing all classroom over all online courses). Like the undergraduate market, to date we do not know the effect that the mass exposure to online study during the pandemic will have on the graduate market, but if the 1980’s Life cereal ad is accurate, a pretty sizeable proportion will have “tried it” and “liked it.”
What does this all mean?
RNL’s 2022 Online Student Recruitment Report indicated that the greatest opportunity in the online education space is in the expansion of availability of bachelor’s level online programs (this is because among our prospective student respondents, the largest proportion (34 percent) planned to pursue online study at this level. Today’s data reinforce that for many institutions, growth will come hand in hand with the availability of online programming. When there were 6+ million more undergraduates who pursued classroom study than online, it was possible for some institutions to decide to “stick to their roots” but when just 1.1 million now prefer classroom study, online is a fundamental ingredient for growth.
What can you do to optimize your online enrollment?
Do you know how to choose, build, market, and recruit for online programs? Do you want to give away half your revenue (and control of your programs) in order to serve the needs and preferences of today’s students? If you have answered “no” to any of these questions/issues, let’s talk.
RNL has developed a comprehensive suite of services from which you can choose what you need, skip the things that you are already doing well, all with a level of transparency to allow you to advance your own expertise during your partnership. Contact us and our online enrollment experts can set up a time for you to discuss your best strategies for success.
Transform your success with graduate and online enrollment

Find out how RNL Enable can support your graduate and online enrollment across the student lifecycle:
- Strategy and Market Research
- Instructional Design
- Lead Generation and Enrollment
- Student Success and Completion
About the Author

Scott Jeffe has worked with more than 200 institutions in 40+ states to apply market data to strategic decisions. With a focus on profiling the demands and preferences of nontraditional (adult, online, etc.) students, Scott...
Read more about Scott's experience and expertise
Reach Scott by e-mail at Scott.Jeffe@RuffaloNL.com.