enrollment
5 Stats That Graduate Enrollment Leaders Need to Know

I recently developed a new data-driven presentation called “How to Win in the Graduate Market” that seeks to first lay out the state of the market and then talk through a list of 20 things that enrollment leaders need to be sure are happening in order to align with student expectations. You can sign up for a complimentary virtual presentation of this session.
As I did that, I wanted to address five statistics that keep coming up in my conversations with graduate enrollment leaders. Two competing—and contradictory—reports have been released in the last 30 days that seek to portray the state of the graduate education market, and my own analysis of the most recent IPEDS completions data are adding to our understanding of graduate enrollment trends.
Down 4.7 percent. As we reported last month, the most recent Council of Graduate Schools (CGS) annual “Graduate Enrollment and Degrees 2012-2022” report highlighted YoY enrollment contraction of -4.7 percent among CGS member schools. Because CGS does not include some of the institutions with the largest online enrollment in the country, I had some concerns about these data. But should enrollment leaders be concerned?
Up 3.9 percent. CGS also reported that applications grew by +3.9 percent. In an Inside Higher Education story one of the authors positioned this discrepancy as one of the effects of the strong job market. While this is at least partially true, any time applications are up and enrollment is down you have to consider whether there are challenges in quality lead generation or if cultivation and admittance practices are not meeting the expectations of today’s students. Enrollment leaders can check if they are meeting these expectations by reading our 2023 Graduate Student Recruitment Report.
Down 0.9 percent. National Student Clearinghouse reported in October 2022 (the year aligning with the CGS data) that graduate enrollment had contracted by just -0.9 percent. These data showed a softening, but was this the beginning of a long slow decline similar to what is happening at the undergraduate level or something different? Graduate enrollment leaders need to know if the situation is challenging or dire!
Up 0.7 percent. In early November 2023, National Student Clearinghouse reported fall 2023 YoY growth of +0.7 percent, nearly erasing last year’s losses. As I have considered these data over the last 18 months, I have thought that graduate education was due for a “correction” back to pre-pandemic rates of growth, and these new data strengthen my case. Enrollment leaders need to be ready for a graduate market that is tight, but not one that is in freefall (as long as they are meeting prospective student expectations.)
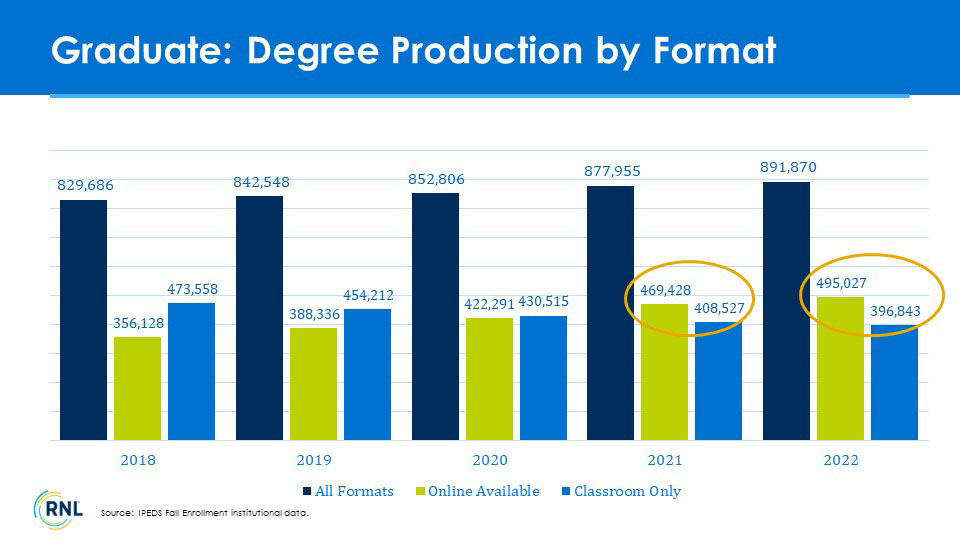
Up 1.6 percent. As I impatiently await the release of the full 2022 IPEDS data, I decided to see what the analogous completions data that IS available indicate about the master’s market. Total degree production (of nearly 900,000) increased by nearly 14,000 degrees YoY, with degree production among online-available programs exceeding classroom-only programs for the third year in a row. In fact, programs that can be completed fully online exceeded classroom-only programs by nearly 100,000 students. These data demonstrate that not only are graduate students “voting with their feet” for online programs, but they are completing them also. These data add to the case that enrollment leaders should be making to their institutional and academic leadership that a robust set of online programs is essential for enrollment health.
How can you win the graduate market?
Ask for a complimentary presentation on the 20 ingredients for success in maximizing graduate enrollment. You will learn a lot of insights in 90 minutes and find ways to strengthen your graduate marketing and recruitment.
What does this all mean for graduate enrollment leaders?
Whether the trend is toward growth, stasis, or contraction, there is more competition than ever, and we are serving more demanding students than ever. With this in mind, here is a short checklist of things you need to be doing:
- Marketing your programs on the channels that students use to find programs.
- Develop and use personas that reflect the types of people who enroll in each of your programs.
- Respond to inquiries and early questions within hours – not days – of receipt.
- Ensure that communication is personalized, and includes emails, texts, and phone calls.
- Offer instruction in accelerated terms.
- Offer online versions of most of your high demand programs.
- Reflect the skills employers indicate are most important in each of your programs.
- Admit students in a timely manner – ideally within one week of receipt.
How did you do? If you are wondering what the passing score is, I can’t tell you. Not delivering on any of these could be the difference between growth and contraction. But we can discuss in much more detail in the “How to Win in the Graduate Market” presentation. Sign up for this complimentary session today and see how much you can learn.
About the Author

Scott Jeffe has worked with more than 200 institutions in 40+ states to apply market data to strategic decisions. With a focus on profiling the demands and preferences of nontraditional (adult, online, etc.) students, Scott...
Read more about Scott's experience and expertise
Reach Scott by e-mail at Scott.Jeffe@RuffaloNL.com.