enrollment
Nontraditional Student Satisfaction: What You Need to Know
Nontraditional students are becoming the new tradition for colleges and universities. One in three students are enrolled in at least one online course, and online enrollments have increased by 3.4 percent while on-ground enrollments have declined 1.2 percent (according to the NCES Digest of Education statistics). Nearly two-thirds of part-time students at four-year privates and half of part-time students at publics are 25 and older, while 11-15% of full-time students are adult learners at these institutions. In addition, “Fast Facts” from the NCES show that 37 million students in the United States have some college but no degree—a large pool of potential adult learners who may come back to college, many through online learning.
With an increasing number of nontraditional students coming to college, what do we know about this population? Ruffalo Noel Levitz has been surveying adult, graduate, and online learners for years with our satisfaction-priorities surveys. Here are key things every institution needs to know about nontraditional student satisfaction.
Nontraditional students are very satisfied
Nontraditional students—adult undergraduates, graduate students, and online learners—have generally higher satisfaction levels than their traditional student counterparts. The 2018 National Student Satisfaction and Priorities Report reflects the following summary satisfaction scores:
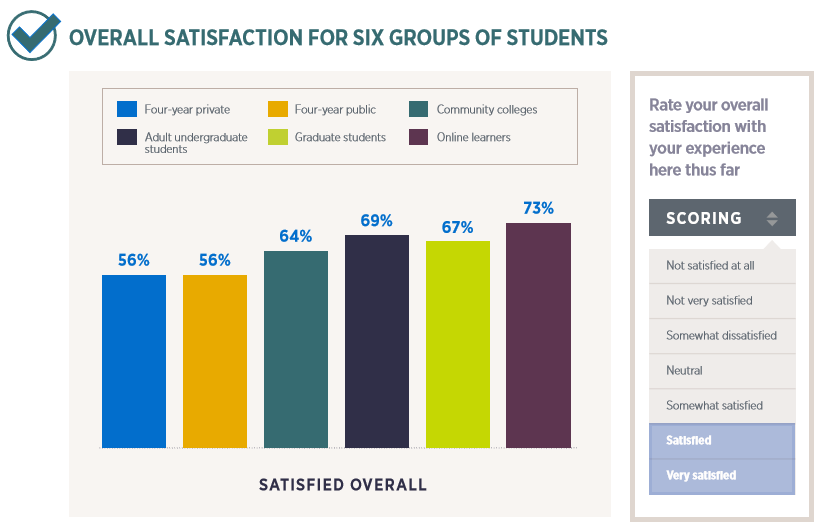 The three nontraditional student satisfaction data sets reflect higher summary satisfaction scores than the four-year private, four-year public, and community college data sets (which are dominated by students 25 years of age and younger).
I often say that if nontraditional students aren’t satisfied, they likely aren’t enrolled at your institution because they don’t have time for less than a high quality experience. These students are often choosing to pursue higher education while balancing other life commitments of work, family, volunteer activities, etc., so they are going to have high expectations if they are enrolled at your institution as well. I have also heard it said that adult learners may not immediately identify as “students” when asked to describe themselves (“I am an assistant at XYZ Corporation; I am a parent; and I am also taking classes at ABC College.”) so when the pressure of life closes in, enrollment at the college may be the first thing that gets dropped.
Older and more satisfied
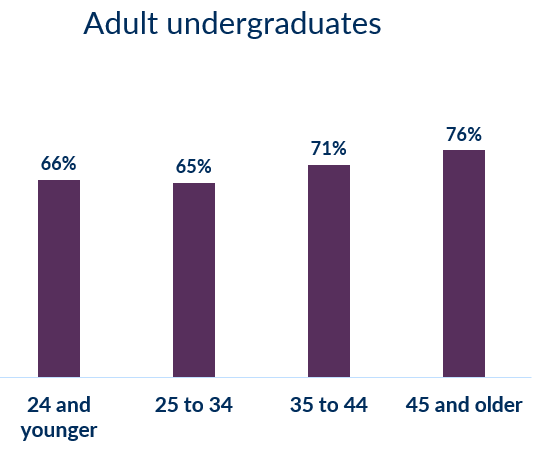
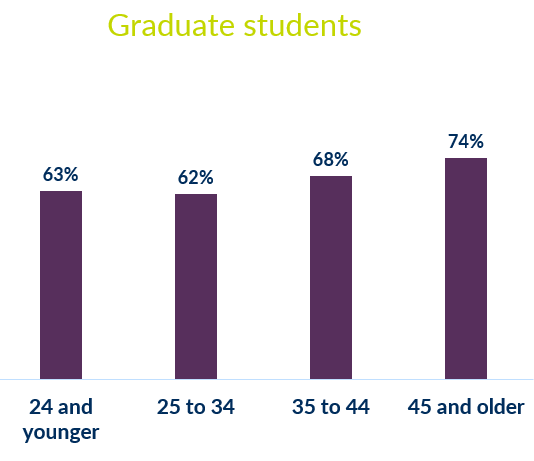
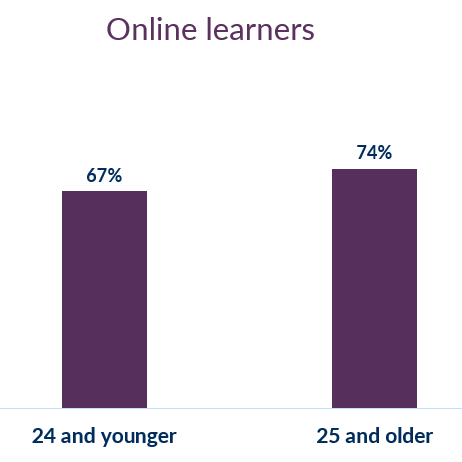
This year’s National Report takes a closer look at demographic subpopulations to identify where student groups are more or less satisfied with their experience. With this approach, we can see that a big influencer on overall nontraditional student satisfaction is the age of the student, with older students indicating higher levels of satisfaction in each data segment.
Student satisfaction by age
What are the age ranges for your nontraditional students? Do you have students on the lower end of the age range (25-34) who may be generally satisfied, but who may still be at risk for leaving the institution if you are not scheduling classes at convenient times, making it easy for them to get access to the support services they need and encouraging your faculty to be understanding of their life circumstances?
When gathering student satisfaction data, it is important to assess your nontraditional populations as well as your traditional students, and then look at the data by demographic segments to target your actions. While your enrolled nontraditional students are more likely to be generally satisfied with their experience, there will still be areas where you can make additional improvements which will help you to attract additional students to your programs.
Satisfaction levels for other demographic populations
In addition to examining student satisfaction by age indicators, this year’s report also slices the national data for nontraditional populations by:
- Institutional Choice
- Race/Ethnicity
- Gender
- Employment
- Class Load
 The data is reviewed separately for adult undergraduates, graduate students and online learners (as well as traditional students at four-year privates, four-year publics and community colleges). Institutional choice in particular has a powerful link with overall student satisfaction for students at all levels and all institution types.
Understanding which populations have higher and lower satisfaction overall, can point campuses in a direction to more deeply explore unique experiences with campus climate, instruction, registration, financial aid and other campus services for potential improvements. (See my previous post for more detailed discussion about examining these different populations.)
I encourage you to download this year’s 2018 National Student Satisfaction and Priorities Report and to consider how you can work on your campus to improve satisfaction for your nontraditional student populations. If you are not currently surveying student satisfaction on your campus, you may want to add this assessment to your activities to provide the student voice to your student success efforts. RNL offers a full suite of satisfaction-assessment instruments for traditional and nontraditional students, used by campuses of every size, type and mission. I encourage you to learn more about how student satisfaction can offer tremendous benefits to your campus.
About the Author

Julie L. Bryant, vice president for student success at RNL, works directly with colleges and universities throughout North America in the area of satisfaction assessment. Julie is responsible for client service to more than 2,700 institutions...
Read more about Julie's experience and expertise
Reach Julie by e-mail at Julie.Bryant@RuffaloNL.com.