enrollment
COVID-19 Higher Education Enrollment Digital Marketing Trends
Like everyone else, but perhaps with more urgency, COVID-19 has been a hot topic among digital marketers since March (including us). Many of our campus partners have expressed an interest in learning how COVID-19 has directly impacted website analytics and digital advertising throughout this time. As we approach the conclusion of the fall marketing “season,” our team wanted to provide data-driven insights on the most significant higher education digital marketing trends we have seen since the beginning of the pandemic. The data contained below are drawn from the broad range of RNL campus partners from which we were able to compile multiple data points to offer insight into digital advertising trends from major advertising platforms.
Digital advertising trends
Within our digital advertising platforms, such as Google Ads and Facebook, several trends have begun to emerge across key metrics. These trends and insights were identified through a comparison of platform data gathered since the beginning of the global pandemic with the previous year. This allows us to begin to see how the ongoing effects of the pandemic have affected campaigns and/or paid media performance. We decided to break down three paid media channels into three categories (Click-Through Rate, Cost Per Lead, and Conversion Rate) as the framework to identify trends and insights.
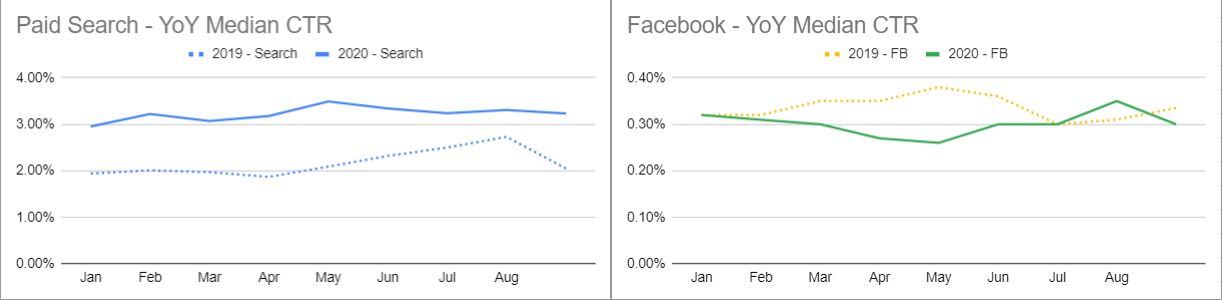
2020 COVID-19 Click-Through-Rate (CTR) Highlights
Facebook and paid search each display interesting trend lines of median CTR when compared with the same time period in 2019. These two channels appear to have experienced the heaviest year-over-year changes to CTR in a comparison of pre- and post-pandemic data among all paid advertising channels.
Paid search has steadily shown close to a 1 percent YoY increase, even throughout the early stages of the pandemic, where we would have expected a decrease. On the other hand, Facebook took a more significant hit at the start of COVID-19 and was not able to bounce back until June of 2020. This channel had a much more significant decrease year-over-year, due to the fact that between March-May 2019, Facebook had a much higher CTR than the rest of the year. (Click for on the charts in this post for larger versions.)
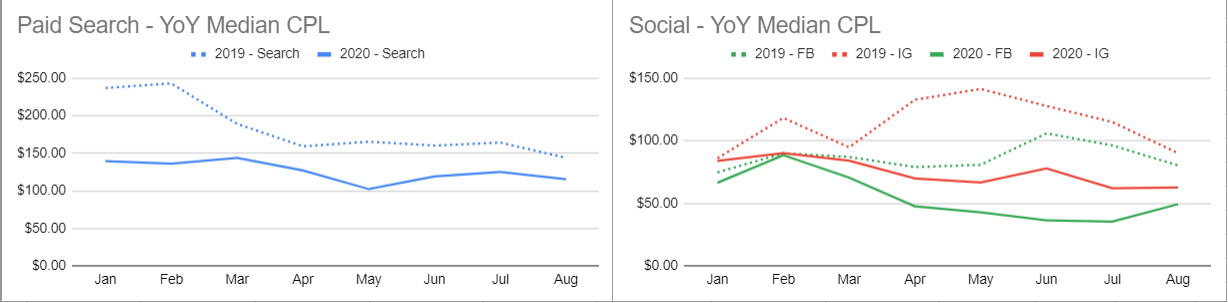
2020 COVID-19 Cost-Per-Lead (CPL) Highlights
In terms of higher education digital marketing trends, CPL went in a different direction than we might have expected. In the early stages of COVID-19, higher spend and lower lead volume were both concerns among both marketers and clients as the uncertainty of the ROI of paid advertising led to immediate budget cuts across various industries—including education. In reality, this abrupt halt decreased competition, allowing for an interesting—and positive—year-over-year comparison in CPL.
Paid search resulted in a significantly lower CPL than in 2019. In fact, paid search CPL averaged $182.67 in January-August 2019, while in 2020, average CPL dropped to $126.06.
Jumping to Facebook and Instagram, Facebook has shown a significant decrease in CPL starting in February 2020, resulting in an average complete year-over-year cost-per-lead of $54.64 (compared with $86.73 for the same time period ). Instagram also saw a similar declines in average cost starting around February of 2020 and has averaged $74.71 CPL through August. The average CPL in 2019 over the same time period was $113.19.
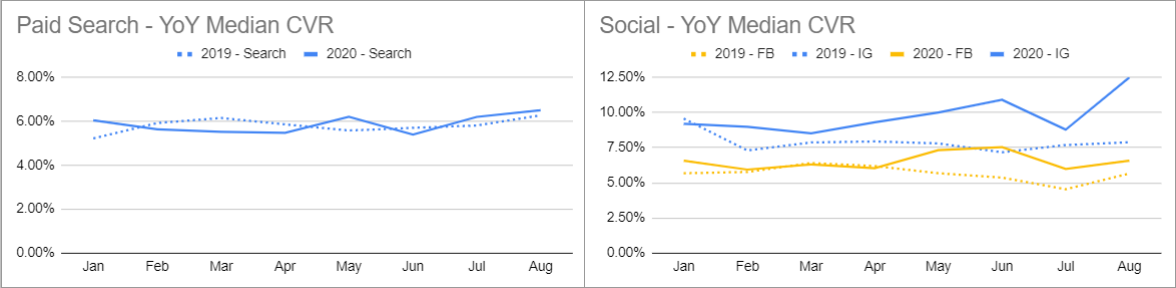
2020 COVID-19 Click to Lead Conversion Rate (CVR) Trends
Conversion rates saw the least impact when evaluating 2019 vs 2020. The median CVR for both paid search as well as Facebook and Instagram only experienced minor fluctuations in data points month-to-month. Paid search kept a fairly consistent trend line from January-August 2020, floating around an average CVR of 5.87 percent. Over the same time period in 2019, the average was 5.81 percent.
Overall, Facebook had a comparable start to the year, but saw a spike toward the end of April bringing the average CVR to 6.54 percent, up 0.88 percent from the 2019 average. Lastly, Instagram stayed above 2019’s average CVR each month, pushing it to 9.77 percent while 2019’s average was 7.9 percent.
Website Engagement Trends
Website traffic trends were first on our list to evaluate to see if our hypothesis—that traffic would begin to trend upwards as the pandemic continued—was correct. The data below showcase a complete aggregation of all types of website traffic from our client accounts (direct, organic, and paid data).
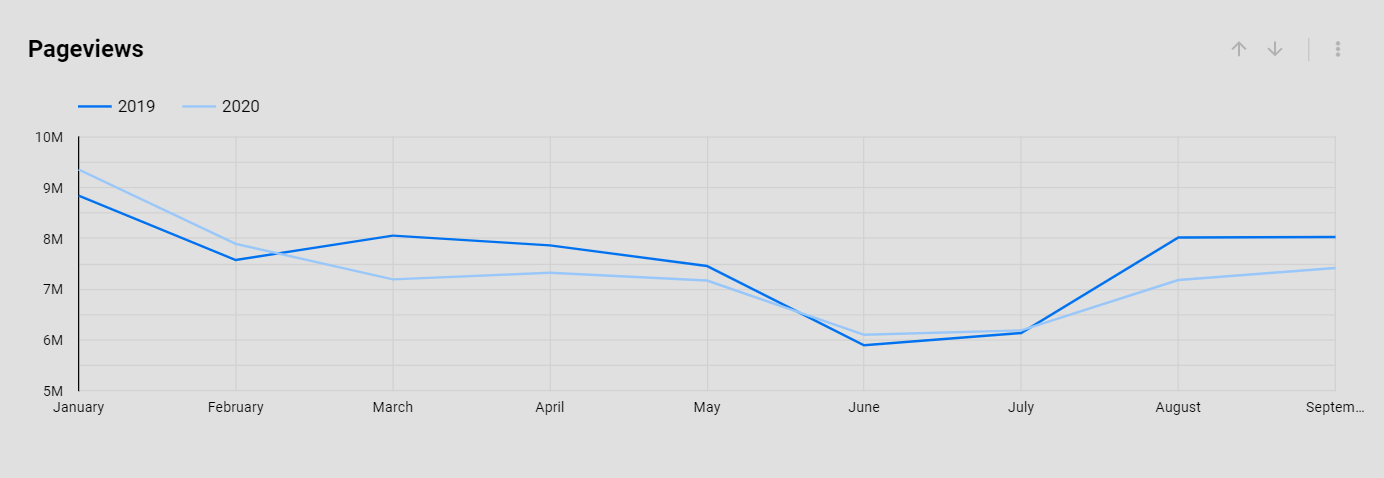
2020 COVID-19 Pageviews Trends
When evaluated across all accounts, page views experienced a slight decrease (~3 percent) when compared with 2018 data. The trend lines in the chart below showcase a few interesting data points to consider while comparing 2019 and 2020 data. The two trend lines appear similar month-to-month, even throughout the months since the pandemic began. While we did not see a drastic dip from early days of COVID-19 (March) that 3 percent decrease in year-over-year page views took the biggest hit from March–May of 2020 as well as in the later months of July-September 2020—months corresponding to rises in COVID-19 cases.
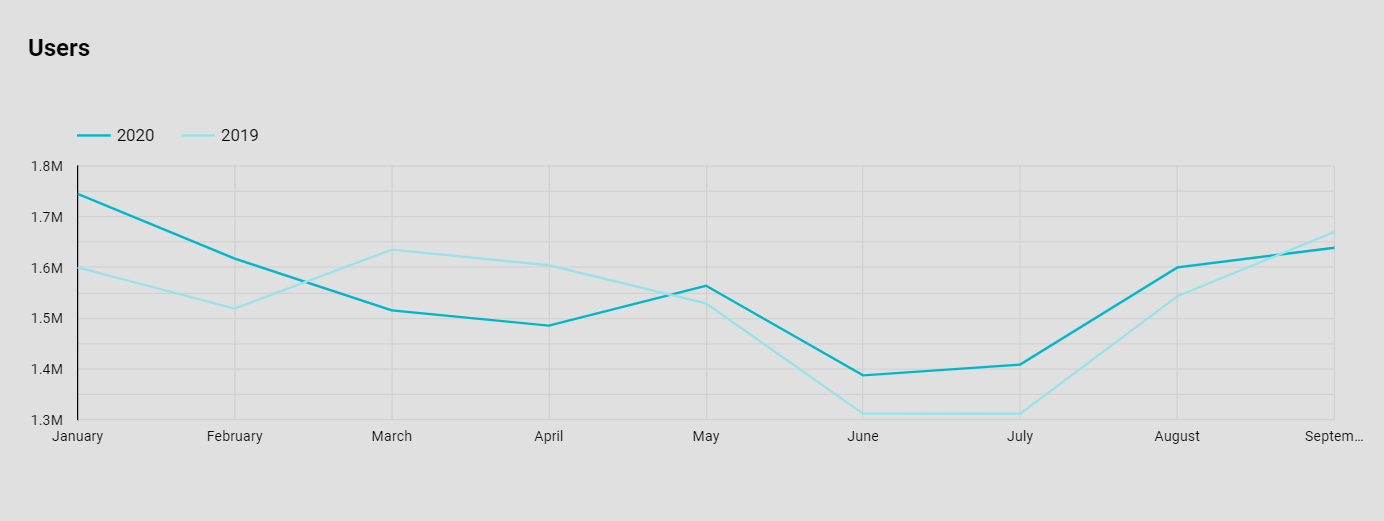
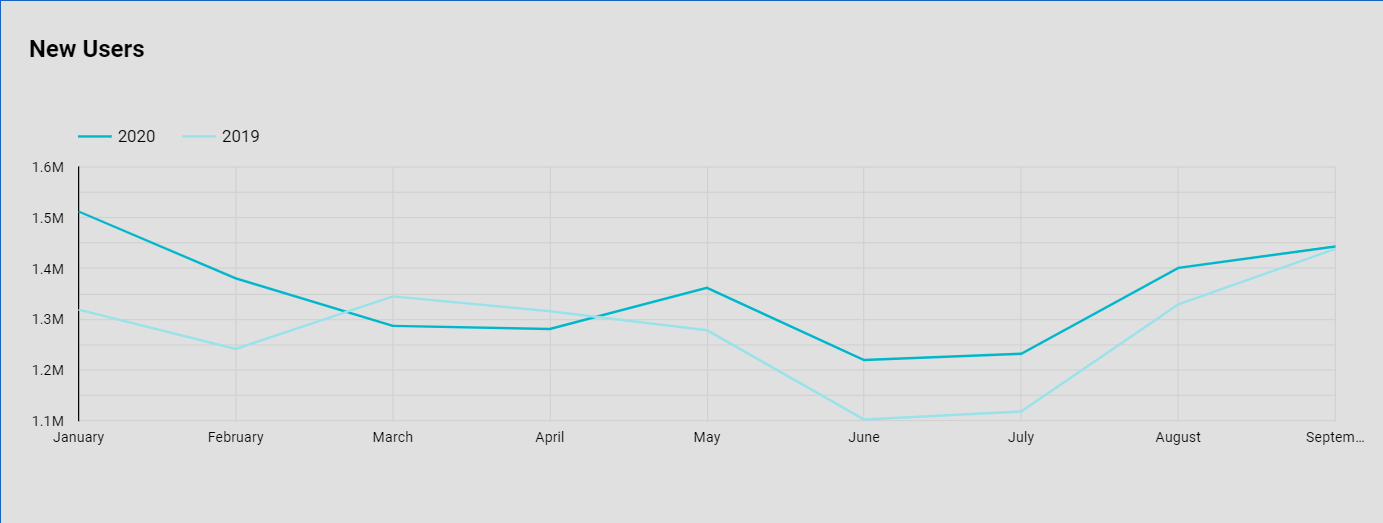
2020 COVID-19 Website Users + New Users Trends
Users and New Users paint a similar story in comparative 2019-2020 trend lines as page views did, but with a different ending. As expected, March 2020 saw the continuation of a decrease starting in January, while March 2019 shows a more typical rise. The exception displayed here is that there has been a slight increase in both Users (~2 percent) and New Users (~5.5 percent) in 2020 when looking at the total counts of each over the same time period in 2019.
2020 COVID-19 Website Sessions Trends
Sessions follow a similar trend as both page views and users with the continued dip in March, instead of the upwards pivot we would have expected from 2019 trend lines. While some periods throughout the year appear to have dipped below the 2019 trend line, the overall count of sessions from January 1-September 30 of 2020 are higher than that of 2019 by about 2 percent.

Conclusion: there is no lasting negative impact on higher education digital marketing trends
COVID had an early impact on the performance of various digital marketing efforts which set website engagement and activity back at start of 2020. While these declines might have been expected or anticipated to continue throughout the rest of the year, the data tell a different story.
Through aggregated data comparing 2020 with 2019 performance, we can determine that COVID has in fact not had a lasting negative impact on our website analytic data. In fact, we have seen in some cases a positive impact on digital marketing efforts. These data indicate that there might be a light at the end of the tunnel as we work our way through this pandemic, highlighting that website and paid performance metrics have not been completely impacted across the board, but instead have affected only specific periods throughout the year so far.
Talk with our digital and enrollment experts
We’re to help you find the right digital marketing and recruitment strategies. Let’s set up a time to talk.
About the Author

Connor Bolin is a digital advertising analyst with expertise in analytics, SEO, conversion strategies, and paid online advertising. He works with colleges and universities to optimize their digital advertising and maximize the ROI of their...
Read more about Connor's experience and expertise
Reach Connor by e-mail at connor.bolin@ruffalonl.com.