enrollment
3 tips for managing retention for the Class of 2020
Most of you at four-year institutions have begun your fall term, or will begin soon, and have welcomed your new class, the class of 2020. But are they really? Some of them will be the class of 2020 and others will be the class of 2021 and a few more will be part of the class of 2022. If you’re reading this, then you’re most likely looking for some ideas for your campus to implement in your retention and completion planning. Here are three tips for you to consider.
Tip 1
First, please know what “normal” retention and completion rates are for your school type. I’ll give you an example but if you don’t know what your type is then please email me at tim.culver@ruffalonl.com and we will define your type. This is the first critical step.
Here’s the example. Let’s assume you are a traditionally admitting school, which means your middle ACT composite range is about 18-24 and your SAT middle score range (all three tests) is about 1290-1650. Also, you are a public institution with a Carnegie Classification of baccalaureate offerings only. If this is you, then your retention rate on average should be about 70 percent and your five-year graduation rate should be around 38 percent.
If the national average for your school type is 70 percent and your campus has set a first-year retention rate goal of 80 percent then you may have a harder time achieving your goal unless you invest in aggressive strategy implementation.
Tip 2
Second, now that you know what is normal, you’ll need to assess what is actual. I always find this to be the most interesting part of the analysis. Recently, I made my first visit to one of the institutions I work with. I met with the Cabinet and they described their vision to have a 60 percent, six-year graduation rate. I asked them what data they had used to establish this vision and the answer was a list of schools they wanted to be like – their aspirant list. I think most schools have either competitor or aspirant lists or both. Anyway, my first question was this: What is your normal persistence and completion pattern? I saw some glances around the room and then asked them to track their 2007-14 cohorts, term-by-term, six years out, so we could see what really happens. The chart below is what really happened.
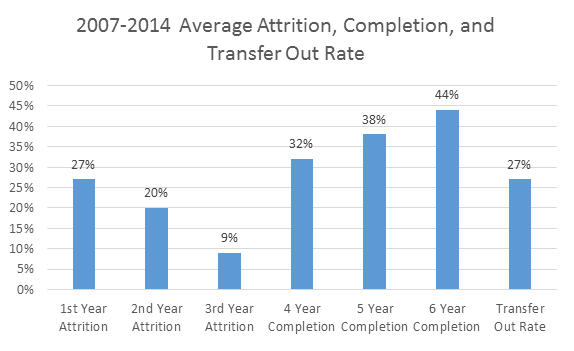
You will notice that average attrition for year one was 27 percent, year two, 20 percent, and year three, nine percent, for a total of 56 percent across the three years. Of this total, 27 percent transferred to another institution which meant that 29 percent did not attend another institution. I also noticed the six-year completion rate was 44 percent normally but they had a vision for 60 percent. This leads us to the third idea for your consideration.
Tip 3
The only way to achieve a vision is to assess your normal attrition patterns which should be about half as much in each subsequent year. In the example above, year two attrition should have been around 13 or 14 percent. When we assess whether or not our completion vision is realistic we must first look to see where we need to resource our planning effort. In other words, where will this school find 16 percent more students from the first, second, or third year? Sometimes, the vision has to right-sized or phased in over a few years. Sometimes, institutions find it is important to resource strategies in both the first and second years in order to minimize the attrition.
So, please know what type of institutions you are, be aware of your normal attrition, completion, and transfer out patterns, and then adjust accordingly with your planning effort. Setting goals without this type of assessment may lead your campus into excessive activity without goal achievement. If you want your class of 2020 to be higher than past four-year completion patterns, then complete this exercise and determine where you need to resource your planning effort to achieve a higher outcome.
Strategy Analysis for Retention and Completion
Assess your student success, retention, and completion efforts
Are you interested in more ideas for tracking and managing retention? Ask for an on-campus retention management analysis from Ruffalo Noel Levitz. This fully customized review provides you with the opportunity to:
- See how to leverage fiscal, human, and technological resources to increase completion
- Uncover hidden retention opportunities among specific student populations and programs
- Create a roadmap of possible improvements to existing services, practices, and plans.
Call us toll-free at 800.876.1117 to request your retention strategy analysis, or email ContactUs@RuffaloNL.com.