enrollment
Understanding the impact of FAFSA filing and visiting campus on college student yield rates
When I worked in admissions for small colleges and had to battle for every student we enrolled, I tried to comprehend the factors that were most predictive of enrollment and that could help in my attempt to best estimate likely enrollment throughout the cycle. The good ol’ fashioned “1,2,3” or “Hot/Medium/Cold” lists still hold water and are effective, but I needed to understand more precisely how impactful these behaviors were and if they truly influenced enrollment.
I found two significant influences, both of which are also known to most enrollment managers:
- If a student completes the FAFSA (and sends their results to you), then they are much more likely to enroll.
- Likewise, students visiting campus in an official capacity are much more likely to enroll than those who do not visit campus.
Having a student both complete the FAFSA and visit campus is a home run. A student who does neither is what I was taught to consider a “rotten banana.” The longer a banana sits, the more rotten it becomes. Along those lines, the longer a student sits in your pool doing neither of these activities, the more their enrollment chances begin to decay.
As I said, this is not a revelation to anyone who has worked in admissions for any significant time. However, in my work as a consultant, I see many campuses that do not know how to incorporate these predictive behaviors into their recruitment planning. By drilling down into the metrics, tracking them, and building plans on that data, you can become much more efficient and effective in your recruitment efforts.
(For the purposes of this blog, I will be focusing on only first-year (direct from HS) domestic students.)
Track and increase the campus visit percentage of your admit pool
First, do you know what percentage of your admit pool visits campus at least one time? While students will certainly visit campuses more than once (which is a very good thing as yield tends to increase exponentially), the marker for this is unique visits. For example, if a student visits campus five times, it’s still one ”unique visitor.” What you are trying to conclude is what percentage of your admit pool visits and, conversely, what percentage of the admit pool doesn’t visit.
I mined the data of 80-90 campuses from around the country (“with a little help from my friends” at Ruffalo Noel Levitz, to borrow a line from Joe Cocker), and found the following:
While not the case in every situation, those institutions with higher overall yield rates tended to have higher visit rates. In the sample, the average percentage of the admit pool visiting campus was 42 percent. The yield rate of visitors was 44 percent, which compares similarly to the results reported in the 2014 Recruitment Funnel Benchmarks Report for Four-Year Institutions. So, if fewer than one in two students in your admit pool are not “officially” visiting your campus, you should develop strategies to drive foot traffic. With average private college yield rates dropping to 26 percent in the report cited above (and 28 percent in the sample), this would suggest that visiting campus provides an increase above overall yield of 16 points with a range of 15-20 points above the overall yield.
Action steps
- Determine the unique campus visit rate (open house, campus visit, individual visit, etc.) of the FY pool and the yield rate of this pool. This will then tell you the percentage of students who do not visit campus. Calculate their yield rate, too. If in any given year the yield rate of campus visitors is 40-45 percent and the yield rate of non-visitors is 5-8 percent, you can then calculate the number of visitors you will need to achieve your enrollment goals.
- Once you determine the foot traffic needed, begin to construct the timeline of your on-campus visit events. These should include open houses, departmental events, talent auditions, etc.
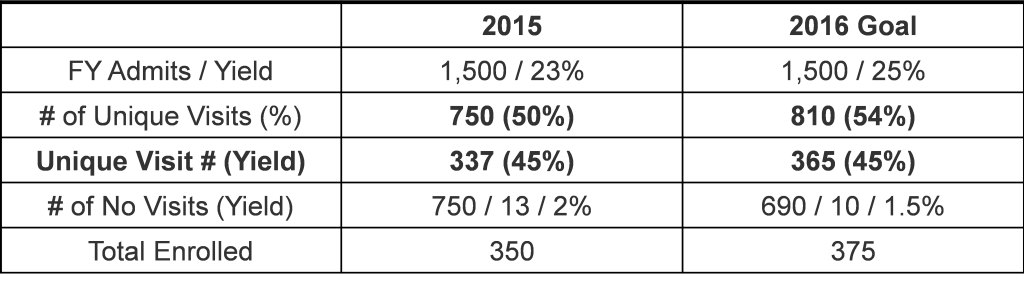
The chart below provides a sample rubric of what you might construct on your campus to determine the number of unique visitors needed to increase enrollment with a flat admit pool. This will also assist in planning (number and timing) of larger open house event.
Track and increase your FAFSA filing rate
We also know that students filing a FAFSA and providing the results to your campus are much more likely to enroll than those students not filing a FAFSA or sending their FAFSA results to you. This is best demonstrated by the 2015 Discounting Report that indicates more than 87 percent of enrolled students at both public and private institutions complete the FAFSA. Again, while I am interested in the act of filing, I am more interested in the impact it has on overall yield rate. Using the same sample from above, I found that the average FAFSA filer rate was 68-69 percent (low of 50 percent and high of 91 percent). Those filing a FAFSA (and submitting results to the college) generated a yield rate of 37 percent, or 9 points above the overall yield rate of the sample of 28 percent. Like campus visit rate, there also appeared to be in most circumstances a correlation of yield rate to filer rate with institutions generating a higher filer rate also having a higher yield rate.
Action steps
- Deploy a three-prong approach (in fall-winter-spring) for encouraging students (and parents) to complete the FAFSA and provide you the results. Incorporate electronic, mail, and phone work in this action step.
- While product and process are addressed earlier in the cycle, price must also be considered. Encourage students to visit your net price calculator to begin the cost conversation. The truth is that financial aid is delivered at every point of the recruitment process.
- For those families that choose not to use a net price calculator, posting sample award scenarios online or having them available in print form can also prove helpful.
Tracking both FAFSA and visit rate and addressing the rotten bananas
The golden ticket presents itself when we can get students to both visit campus and seek aid via the FAFSA. Again, this is not a groundbreaking finding, but tracking can help you benchmark and optimize your efforts. What I noticed was that the average percentage of students in the sample admit pools who were visiting and completing the FAFSA was only 30 percent (and, in some cases, as low as 10-15 percent). In any case, though, the average yield rate of students doing both was 52 percent, or 20-25 points above the overall yield rate. The University of California Regent data reports annually that nearly 6/10 students will enroll at their first choice institution and FAFSA positioning analysis further supports this. The institution that most effectively gains the interest of students early, remains of interest enough for an official visit to occur (assuming the opportunities to visit exist), and sustains interest long enough for a student to seek aid via the FAFSA will likely see its hard work rewarded with incremental increases in yield.
Also of note was that the average percent of students in the samples doing neither activity was 22 percent. This group had a yield of just 3-5 percent. These are the rotten bananas I mentioned earlier. And this final finding shows that nearly all of the enrolled FY students for a campus will come from about 75-80 percent of its FY admit pool.
Action steps
- Monitor your pool at all times for those students that may become “rotten bananas.”
- Ensure all communications indicate upcoming visit opportunities and financial aid priority dates. This includes even the little things like email signatures and “on-hold” messaging.
- Understand what is needed in these categories to achieve goal and build a rubric to drive your planning
There are certainly many factors that influence student enrollment. Those described above are only a few, albeit pretty important. But the lesson here is to start with these two metrics. Track them carefully, act on the data, and guide your recruitment plans with them.
I welcome your questions and comments. Feel free to leave a comment below, or email me if you would like to discuss recruitment metric tracking and optimization. You will also find a whole host of sessions on similar topics at the National Conference on Student Recruitment, Marketing, and Retention (July 8-10 in Boston), including my session, “Financial Aid for Rookies.”