student success
Three college student retention strategies that planning teams should prioritize at this time of year

It’s that time of year when retention committees, student success professionals, and leadership teams all across the country calculate the retention rate for the fall 2013 cohort and compare it with their previous years’ outcomes. Some campuses have undoubtedly stayed the same, others decreased, and some increased, but the overall conversation is usually about how “it” can be done better for the fall 2014 class.
Let’s talk about “it” for a minute. Many of you may have read in a previous post that I don’t believe any of you get up in the morning and go to work to do retention. Retention isn’t what you do. “It” is an outcome of what you do. “It” is the result of quality faculty, staff, programs and services. As you consider improvements to your efforts which will impact the fall 2014 entering class and beyond, please keep in mind the following three student retention strategies and practices.
1. Assess college student retention outcomes completely
The first strategy I want you to consider is comprehensive outcomes assessment. All colleges and universities compute a retention rate at this time of year because it has to be submitted via the IPEDS system as a part of federal requirements. But many schools go above and beyond what is required and compute other retention rates to inform planning purposes. For example, at what rates did you retain special populations or students enrolled in programs designed to improve student success? In order to best understand what contributed to the overall retention rate, other outcomes have to be assessed as well. For instance, how many students persisted but didn’t progress? Before you finalize the college student retention strategies for your fall 2014 students, be sure that you know how your 2013 students persisted and progressed so that strategies can be developed in advance. An example would be a targeted, intrusive, and intentional academic recovery program that happens in spring and summer terms for instance. My friends at Cardinal Stritch University do this very well.
2. Know what worked and what didn’t
The second strategy I want you to think through is assessing what worked well during the previous year and what didn’t. Many of us have been in situations where we continue to do the same thing and expect different results. But as someone once said, that’s insanity! A common example would be the academic advising model. Noel-Levitz has many years of data which show that academic advising is one of the most important college student retention strategies which needs constant care. Here are some questions to consider: Does your academic advising model, its standards of practice, and outcomes assessment reveal that students are academically progressing by taking the courses needed for completion? How many of you could identify for each of your advisees an expected graduation date? Isn’t that one of our outcomes of advising? One of the community colleges that I have had the pleasure to work with during my time at Noel-Levitz actually had an expected completion date as part of their academic advising evaluation each year. Each term, the vice president of instruction would ask each dean to list each student’s expected graduation date. This type of evaluation required advisors to have rich relationships with their students. Those relationships resulted in a quality academic advising approach which basically managed the graduation rate.
3. Don’t limit your scope of activity
Once you have assessed the 2013 class outcomes and the quality of your programs and services, I want you to think a bit differently about how you will develop college student retention strategies which will impact the 2014 class. Each college and university has an attrition curve, or distribution of students with their likelihood of retention. The attrition curve, like any normal distribution, will show which students are least and most likely to retain and it will reveal the majority of students which are under the curve. See the example below.
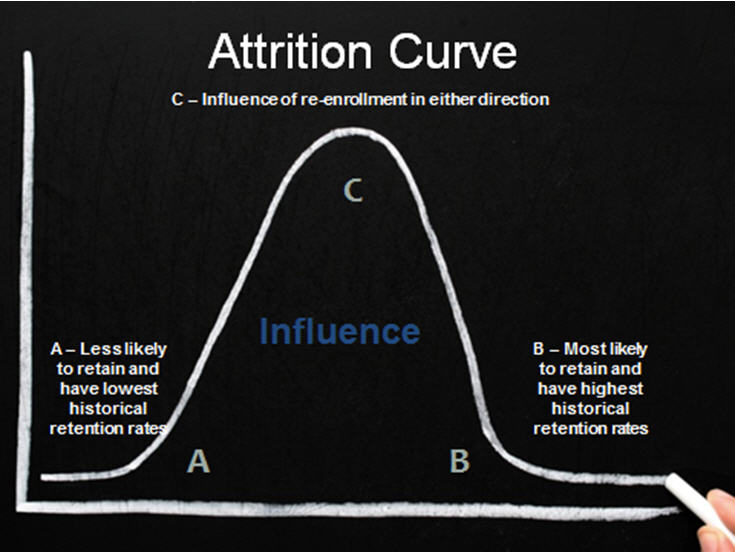
I was at a university recently where we had developed their attrition curve and it was quite a revelation to the planning team that most of their student retention strategies were designed for the tails of the curve. I believe, from my own experience, that most of us spend more time on the tails of the curve but honestly that’s only about one-third of our students. We set goals to increase our retention rate but then we limit our scope. I would like you to consider how you can be more proactive and intentional with your “middle children” who may not even seek services or ask for guidance, and in many instances might even prefer to remain invisible.
Onward and upward
I want to offer my congratulations to those of you who achieved your retention goals for the 2013 cohort. You certainly must have done some things right and must have had student retention strategies which were effective. For those of you who are looking for new directions in planning, consider the three practices above: Complete comprehensive historical analyses and outcomes assessments for your 2013 class, review your existing portfolio of student retention strategies, and don’t limit your scope of activity. Become more intrusive and intentional with the students in the middle of your attrition curve because that is where you will likely experience increases in retention outcomes.
Questions about this post? If you have any questions about how to integrate a new approach or would like to bounce off an idea you are considering to increase student success and retention for your campus, please send me an email.