enrollment
What Might the Great Recession Tell Us About the Future
I have been asked a dozen times recently if there are any data that might indicate what graduate programs (and other levels as well) can expect in the recession that may follow the COVID-19 pandemic. As a “data guy,” I always want to underpin advice with the solid numbers, but I also know that people are craving any indicators that could help them plan for the future.
Before jumping into the data, here’s a summary assessment: although we don’t know what is around the corner, the accumulated data and my experiences working with dozens of schools after the last recession indicate that while schools will have to fight for every student—and those with a robust virtual infrastructure will have the easiest time—graduate (and online) programs may fare the best in a tough situation.
This is at least partially informed by the fact that the past two recessions have impacted Americans with better jobs and higher incomes far less than other Americans (more on that at the end of this piece).
A look at the trend data
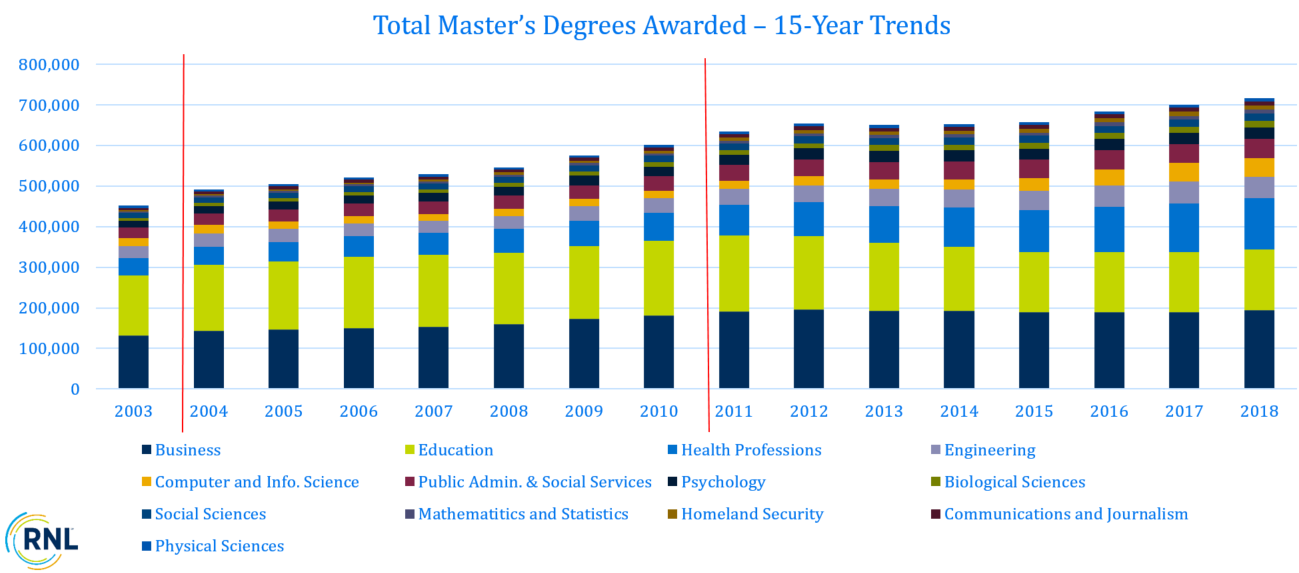
With all of this in mind, I conducted an analysis of NCES trend data on master’s degrees awarded in the largest disciplines over the last 15 years (2003 to 2018). This window included not only the “Great Recession,” which officially ended in June 2009, but also the eight-month recession of 2001.
I looked at both total master’s degree production trends as well as annual percent change trends. While enrollment data (as compared with “completions” data) presents a more comprehensive profile of program penetration, I would argue that data on degrees awarded (essentially data that documents persistence) is likely the most accurate in assessing the impact of a recession.
Many of us who have long-worked in higher education are familiar with discussions about how the Great Recession differed in so many ways from past recessions. While this is true, in one way it was quite similar. While it didn’t lead to dramatic spikes in enrollment, there was steady enrollment growth in each of the years immediately following its peak in 2009. Trend data indicate that while those responsible for enrollment worked harder than ever with every dollar after the recession hit, their efforts paid off.
The data below demonstrate that growth was actually stronger in the few years immediately following the recession and began to flatten once the economic recovery was in full swing. These data perhaps prove the old continuing education maxim, “when the economy is bad people go back to school.” In fact, 2013 was the first year that master’s completions declined (by 4,249) since 1985. Degree production almost immediately popped back up (regaining 2,864 of the lost degrees in 2014), with growth in each of the last four years. (see chart below).
This reminded me of the excellent work done by Brookings over the last decade—particularly a 2010 report (Degrees of Separation) and a 2018 follow up (“Workers with low levels of education still haven’t recovered from the Great Recession”). These pieces posit that regardless of high profile stories about white collar job losses (think Wall Street, Insurance, etc.), the real losers in the aftermath of the Great Recession were those with the lowest levels of higher education—and the most to lose. Combine all that Brookings documented (which is the subject for another day) with ceaseless tuition increases and it is easier to understand why more Americans at the lower end of the economic spectrum may not have returned to the classroom.
Annual growth by the numbers
Many individual schools and programs struggled to grow enrollment in the period starting in fall 2009—just as the recession “officially” ended—while many grew. The data below confirm these mixed experiences (I am using 2011 as a benchmark point, assuming a two-year lag from the peak of the recession). In fact, only two of the 13 program areas felt a negative effect of the recession.
Why did those years feel so bad then? Because the two areas—Business and Education—had been the strongest programs (some would say the “cash cows”) for years. Here are the data:
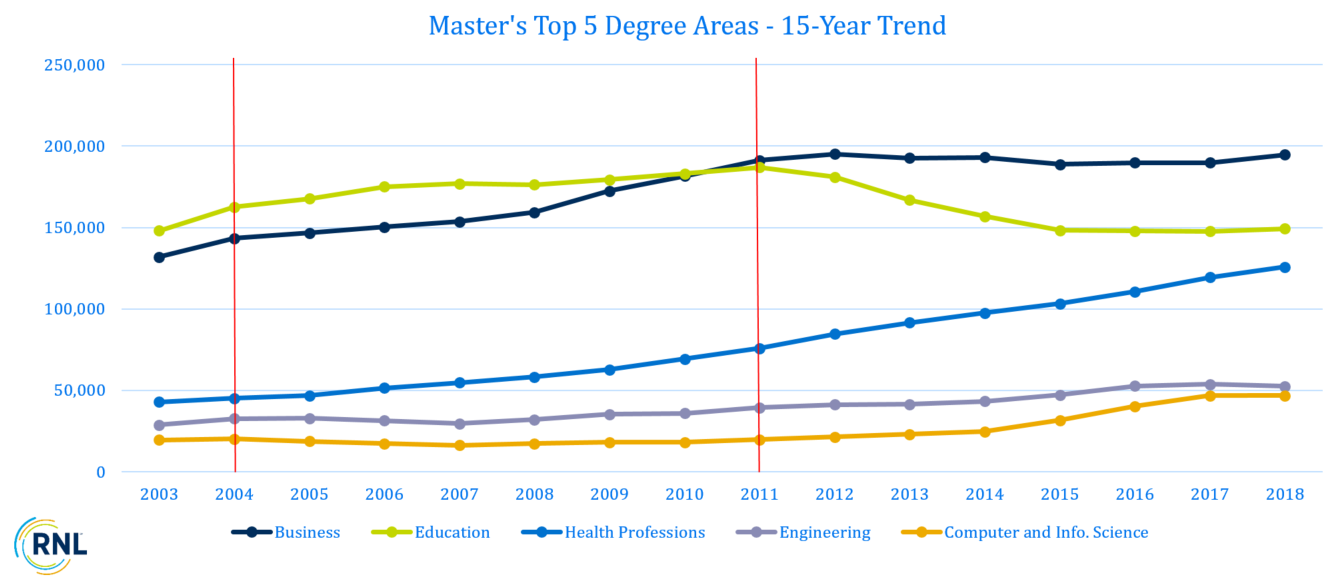
Key observations by discipline:
- Business: After a decade of growth largely fired by the massive rise in interest in MBA programs, Business master’s programs have never recovered their momentum in the aftermath of the 2009 recession. The recent growth of Business master’s programs (as well as online versions of MBA programs) has stabilized the Business discipline, while classroom-based MBAs at nearly all levels continue to decline. (I took a deeper dive into this trend in an earlier blog.)
- Education: After decades of generating the largest numbers of students—in fact, Business programs didn’t overtake them until 2010—Education master’s programs began a nosedive in 2011 that took five years to stabilize. Since then they have been unable to kick-start growth, but they have indeed stabilized. The decline has been centered on master’s degrees in teaching, while growth in education and higher education administration and other ancillary programs in the discipline have contributed sizably to stabilizing the discipline.
- Health Professions: Programs in healthcare-related fields skyrocketed in the years since the recession. In fact, the meteoric growth of such programs began just as the recession started in 2009 and they have never looked back. While nursing played a pivotal role in growth, an array of programs contributed mightily, particularly health care administration.
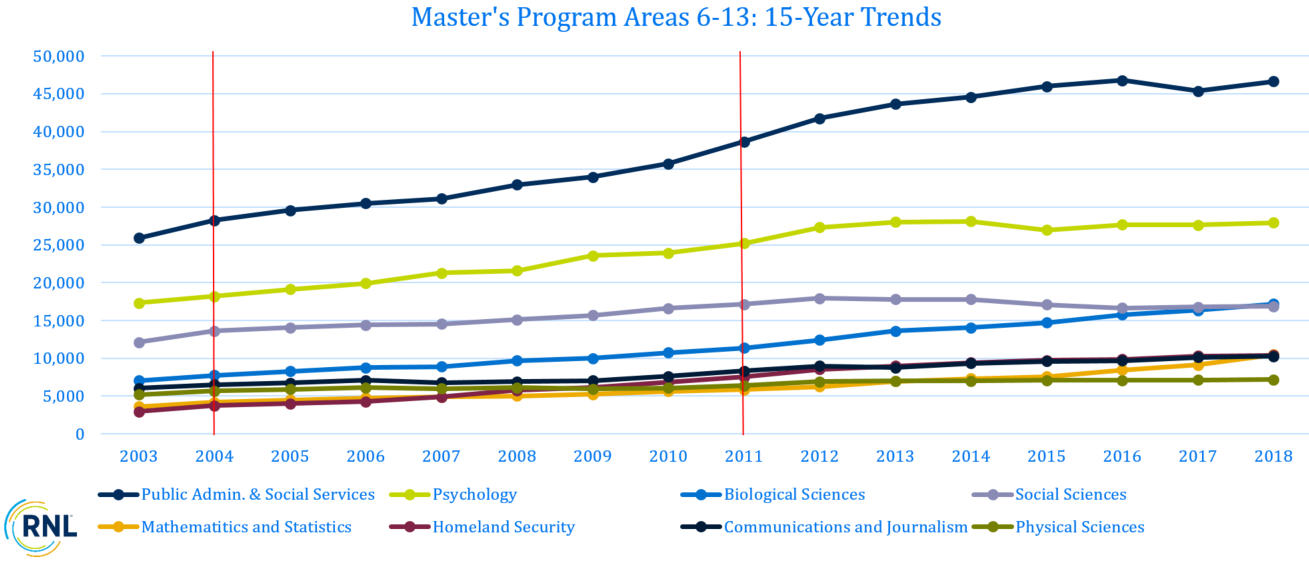
- Public Administration and Social Services: Program growth in this discipline is largely attributed to the fact that Social Work is included in this group. While other programs also grew, there has been massive growth in Social Work—particularly among programs that are available online.
- STEM: Programs in both Engineering and Computer Science held their own in the years immediately following the recession and have picked up speed—particularly in computer and information sciences in more recent years.
- Psychology: Programs in this discipline held their own across the entire period since 2011, with incremental growth being driven almost entirely by programs that are available online.
- Homeland Security: While not accounting for more than approximately 10,000 master’s degrees in 2018, have tripled since 2003, and have grown 21 percent in just the last five years—largely driven by programs that are available online.
- Other successes: Programs in Mathematics and Statistics as well as in the Biological Sciences experienced steady and consistent growth in the years since the last recession.
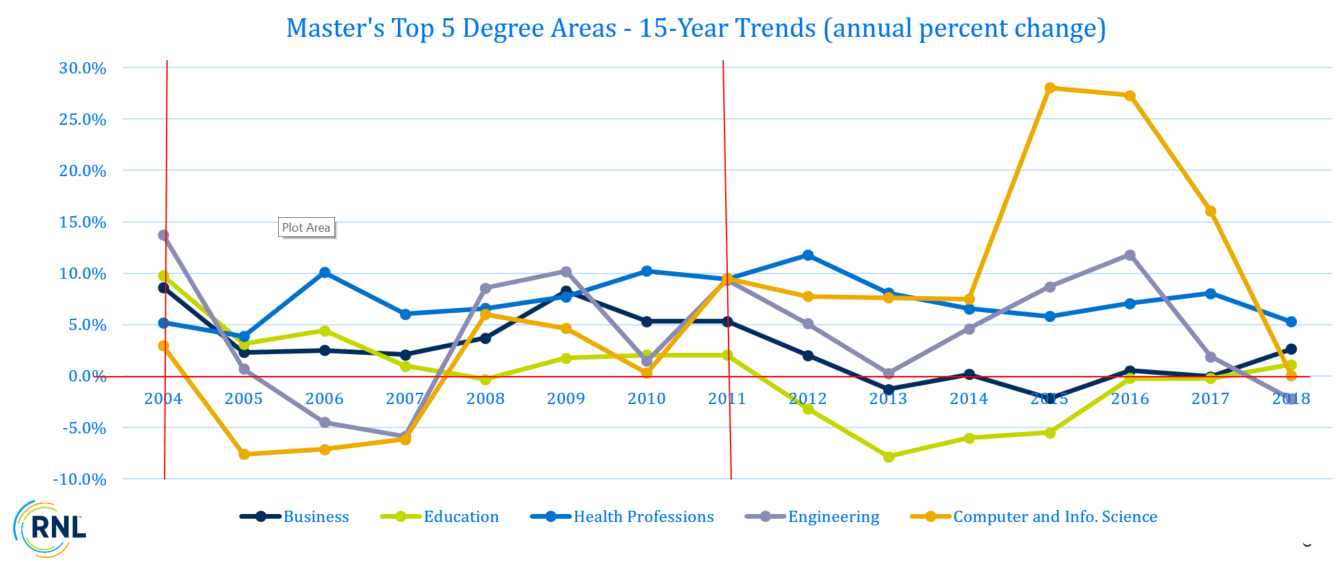
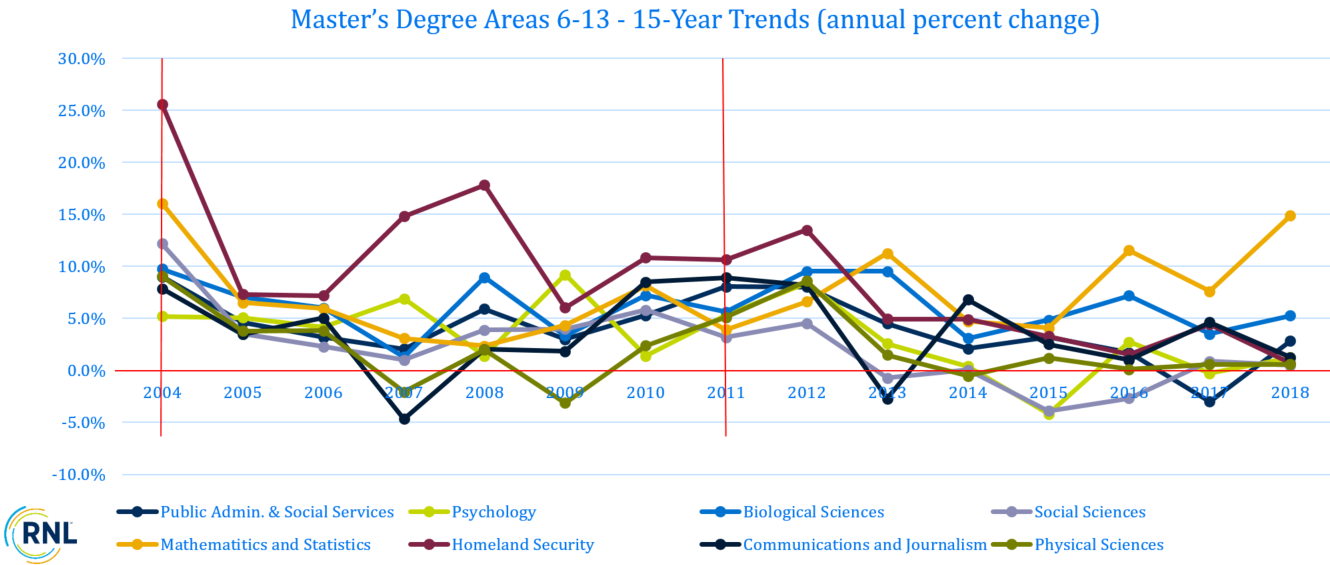
Annual growth by percent
I also analyzed data on annual percent change in degrees awarded for each of the 13 disciplines. In the following charts, the red lines identify the two points at which the impact of the last two recessions would have started to affect master’s program performance, as well as the “zero growth” point.
These data indicate in clear terms that while annual growth dipped somewhat after the 2009 recession started (first seen in 2011 data), only in Business, Education in the first chart, and Communications, Social Sciences, and Psychology in the second chart experienced actual declines in the numbers of degrees produced in the recession’s aftermath.
Conclusion: Making the most of every enrollment opportunity in this environment
While these data represent what happened in the recent past, there is no way to tell if they can predict what will happen in the coming months and years.
What we do know is that we are confronting a period filled with even more of the already copious challenges that our institutions of higher learning are already working on. Yesterday’s challenges were largely driven by demographics producing a stagnant if not declining number of prospective graduate students and more institutions than ever before trying to recruit them.
In a recent review of NCES data, I found that in the last five years an additional 141 institutions reported master’s level enrollment, bringing the total number of institutions to more than 2,000 for the first time. Of these institutions, 716 of them had total graduate enrollment of 200 or fewer students. In that same time, enrolment grew by almost 400,000 students—most often accruing to existing, large institutions with robust online programs.
At the same time, due to a range of concerns emanating from the COVID-19 pandemic, a portion of American families may be more likely to be reluctant to send their children away to the schools of their dreams, thereby reducing revenue from that stream. This will make every dollar even more valuable and will put even more pressure on graduate programs (and online programs) to perform.
There has never been a more important time to ensure that you are using every dollar effectively—and we can help. Reach out and let us know if you would like to talk, and we’ll set up a time to discuss your enrollment strategies.
About the Author

Scott Jeffe has worked with more than 200 institutions in 40+ states to apply market data to strategic decisions. With a focus on profiling the demands and preferences of nontraditional (adult, online, etc.) students, Scott...
Read more about Scott's experience and expertise
Reach Scott by e-mail at Scott.Jeffe@RuffaloNL.com.