enrollment
Eight ways to get the most from college recruitment funnel tracking
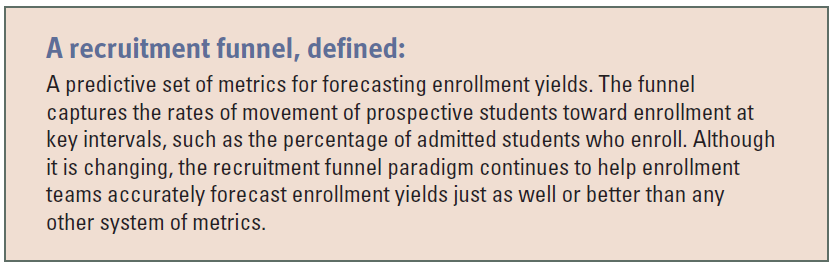
Accurate funnel tracking for college student recruitment remains critical. Why? Because accurate college student funnel data remain one of the best resources available to project enrollment for today’s colleges and universities.
The following are some specific suggestions for how colleges and universities can get the most value from funnel tracking efforts in today’s higher education environment. For further information or discussion, consider arranging a complimentary telephone consultation with a Noel-Levitz enrollment consultant.
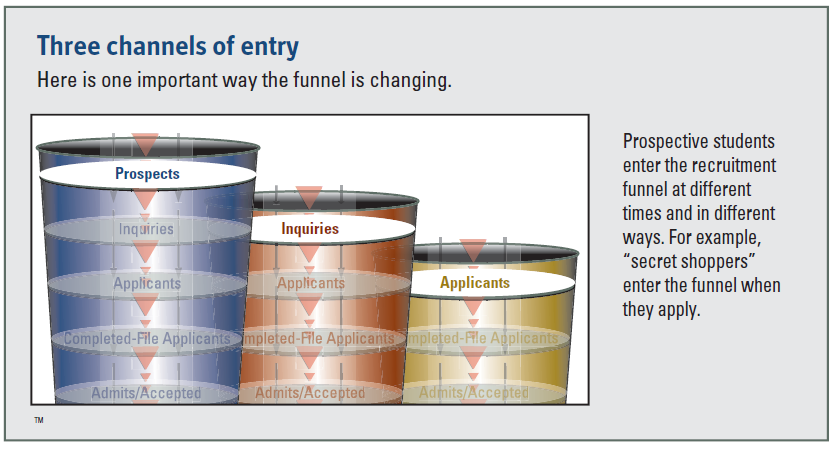
1) Use multiple funnels when you track your institution’s funnel data. As Noel-Levitz’s latest data demonstrate in the 2014 Recruitment Funnel Benchmarks Report, different types of students convert and yield at different rates, so it is no longer possible to use a “one-size-fits-all” funnel. We recommend that most four-year public and private campuses should, at minimum, be using separate funnels for traditional and nontraditional-age freshmen, transfers, in-state, out-of-state, international, and paper vs. online applicants. In addition, separate funnels should be used for those who enter at the application stage (secret shoppers) vs. those who enter at the inquiry stage.
2) Fine-tune your enrollment predictions by comparing your current funnel data to your institutions’ funnel data from previous years. It is essential that every institution look back at its own internal benchmarks first, even before examining external benchmarks such as those from Noel-Levitz. By examining your institution’s historic conversion rates at each stage of the admissions cycle and for each type of applicant, you can better predict where your future enrollment will end up as each day and week of the admissions cycle unfolds. For effective internal benchmark comparisons, we advise our client institutions to store and analyze three to five years of comparative data. To more fully understand how to use this historical trend data to predict and influence enrollment, see the table and illustrations on pages 2 and 3 of the Noel-Levitz white paper, 7 Categories of Admissions Data to Guide Decision-Making.
3) Strengthen your recruitment strategies by using internal and external funnel benchmarks to more quickly identify strengths and challenges/opportunities, and keep building more efficient and effective programs for student recruitment and admission. For example, in places where you see that your funnel rate is significantly lower than a given benchmark, you may find that you need to initiate new activities aimed at raising your rate. Or, in cases where you see that your rate is above a given benchmark, you may decide to build on that area as a particular strength of your admissions/recruitment/marketing program.
4) Go beyond predictions to set more realistic enrollment goals based on multiple funnels. By using multiple funnels and knowing what to expect based on your institution’s past trend data and the benchmarks in the funnel report, your enrollment team should be able to set more realistic goals and subgoals for the populations you are targeting, including goals for specific funnel conversion rates.
5) Take your recruitment funnels to the next level. The external benchmarks from Noel-Levitz, and the internal benchmarks you track at your institution, cannot explain everything that is happening. Because your institution’s students are unique, it’s important to keep tracking and finding unique factors that influence your institution’s funnel rates, based solely on your institution’s trend data even where outside benchmarks are unavailable. While this evaluation process may sound time-consuming, the payoff is often worthwhile as it allows institutions to more accurately predict enrollment for each term. For example, consider tracking the enrollment likelihood of your applicant and admitted pools each year compared to the enrollment likelihood of previous years’ pools through such means as predictive modeling, the numeric order in which your applicants listed your institution when registering for the FAFSA or the ACT, and the financial needs and academic credentials of this year’s pools compared to previous years’ pools.
6) Explore the influence of campus visit days on your conversion and yield rates. If you aren’t doing so already, we encourage you to compare the visitor benchmarks in the Noel-Levitz data to your own rates for converting campus visitors to applicants, your own yield rates on visitors, etc. Tracking campus visitors separately is an excellent practice, because doing so allows you to test the impact of any improvements you may be able to make in the ways you attract and host/inform prospective college students and parents who visit. Be sure to track not only visitor volume, but also the conversion and yield rates of those who visit.
7) Explore the influence of your admissions fees on your conversion and yield rates. In some cases, changing the amount of a fee (higher or lower), or changing the types of admissions fees that students must pay, can lead to increased or decreased enrollments. Consider testing a different fee level to see if it changes your results (be sure to track the change all the way through the funnel). To set up a test, keep in mind the findings shown in tables 16 to 21 of our funnel benchmark report.
8) Keep paying attention to college secret shoppers. College secret shoppers are here to stay. This trend has many implications for reframing college admissions programs, including the need to:
- Treat a portion of the applicant pool similarly to how you would treat inquiries.
- Place greater emphasis on purchased names as a way to identify prospective students.
- Develop new metrics, such as the percentage of purchased names who enroll and the percentage of non-secret-shopper inquiries who apply.